You're uploading tens of thousands of Excel rows to an AI tool, and the API returns "insufficient balance"—but your account clearly has funds? This is a common pitfall when using AI to process large Excel datasets, and it's due to the dual constraints of token pre-deduction mechanisms and context window limitations.
Core Value: After reading this article, you'll fully understand why large Excel files cause errors, how to properly use AI to analyze tens of thousands of data rows, and which solution is the most cost-effective and efficient.
<!-- Error response bubble -->
<rect x="0" y="58" width="256" height="84" rx="9" fill="#2d0808" stroke="#ef4444" stroke-width="1.5"/>
<text x="128" y="80" font-family="'PingFang SC',sans-serif" font-size="13" font-weight="bold" fill="#ef4444" text-anchor="middle">❌ Error 402</text>
<text x="128" y="100" font-family="monospace" font-size="10" fill="#fca5a5" text-anchor="middle">Insufficient Balance</text>
<text x="128" y="116" font-family="'PingFang SC',sans-serif" font-size="10" fill="#fca5a5" text-anchor="middle">Insufficient balance, please recharge and try again</text>
<text x="128" y="132" font-family="'PingFang SC',sans-serif" font-size="9" fill="#94a3b8" text-anchor="middle">(Pre-deducted $9.00 · Balance $5.20)</text>
<!-- AI avatar -->
<circle cx="268" cy="100" r="10" fill="#991b1b"/>
<text x="268" y="105" font-family="sans-serif" font-size="11" fill="#fecaca" text-anchor="middle">🤖</text>

<!-- Confused user thought -->
<rect x="40" y="158" width="218" height="50" rx="9" fill="#0f2028"/>
<text x="149" y="178" font-family="'PingFang SC',sans-serif" font-size="10" fill="#7dd3fc" text-anchor="middle">But I clearly have a balance in my account!</text>
<text x="149" y="196" font-family="'PingFang SC',sans-serif" font-size="10" fill="#7dd3fc" text-anchor="middle">Why does it say insufficient balance??</text>
<circle cx="28" cy="183" r="10" fill="#1d4ed8"/>
<text x="28" y="188" font-family="sans-serif" font-size="11" fill="#ffffff" text-anchor="middle">👤</text>
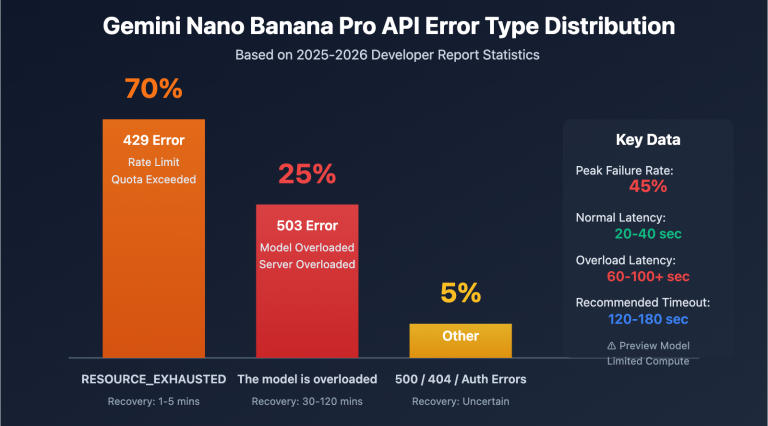
Why Do Large Excel Uploads Result in an 'Insufficient Balance' Error?
Many users are confused when they first encounter this: their account balance is clearly sufficient, so why does the API still return an 'insufficient balance' error?
To understand this, you need to know about a key mechanism of AI APIs: the Token Pre-deduction Mechanism.
Token Pre-deduction Mechanism Explained
When you upload a file and send a request in an AI client like Cherry Studio or Chatbox, the API doesn't wait until the response is fully generated to deduct fees. Instead, the moment the request is sent, it pre-estimates the maximum number of tokens this request might consume and temporarily 'freezes' (pre-deducts) the corresponding cost from your account balance.
This pre-deduction process generally works like this:
- User uploads Excel file → Client converts file content to plain text
- Plain text is entirely inserted into the prompt (dialogue context)
- API calculates input token count + estimates maximum output token count
- System determines: Total pre-deduction amount > Account balance → Returns 'Insufficient Balance' error
So, essentially, it's not that you 'don't have money,' but rather that the pre-deduction amount for this request is too large, exceeding your current account balance.
Fundamental Differences Between AI Clients and ChatGPT
Many people have a misconception: they think uploading an Excel file in Cherry Studio is the same as uploading a file in ChatGPT.
They are actually completely different:
| Comparison Aspect | Cherry Studio / Chatbox | ChatGPT (Code Interpreter) |
|---|---|---|
| File Processing Method | Converted to text and fully inserted into context | Processed by running code in a sandbox environment |
| Token Consumption | File size directly equals token consumption | Doesn't consume dialogue context tokens |
| Suitable File Size | Recommended within 100 lines | Supports larger files (official limit approx. 512MB) |
| Data Analysis Capability | Text understanding only, cannot execute code | Can directly run Python for statistics |
| API Access Method | Invoked via API key, billed by token | ChatGPT Plus subscription model |
🎯 Key Insight: When using an API proxy service (like APIYI apiyi.com) to invoke AI, file uploads go through a third-party client. All file content is converted into text tokens and passed to the Large Language Model. This is completely different from ChatGPT's official file processing sandbox mechanism.
How Many Tokens Do Large Excel Files Actually Consume?
Before we discuss solutions, let's get an intuitive understanding of token consumption.
Token Conversion Basics
| Content Type | Token Estimate |
|---|---|
| 1 English word | Approx. 1-2 tokens |
| 1 English character | Approx. 0.25 tokens (4 chars = 1 token) |
| 1 Chinese character | Approx. 1-2 tokens |
| 1 Date (e.g., 2024-01-15) | Approx. 5 tokens |
| 1 Number (e.g., 12345.67) | Approx. 3-4 tokens |
| 1 Row of Excel data (10 columns) | Approx. 30-80 tokens |
Real-world Case Calculation
Let's take a real-world scenario encountered by a user as an example:
File A: 60,000 rows × 10 columns of process efficiency data
# Estimate: 60,000 rows × 10 columns × average 5 tokens/cell
# = 60,000 × 50
# = 3,000,000 tokens (Approx. 3 million tokens!)
File B: 40,000 rows × 8 columns of business data
# Estimate: 40,000 rows × 8 columns × average 5 tokens/cell
# = 40,000 × 40
# = 1,600,000 tokens (Approx. 1.6 million tokens)
Large Language Model Context Windows and Cost Comparison
| Large Language Model | Context Window | Input Price ($/1M tokens) | Cost to Process 3M tokens |
|---|---|---|---|
| GPT-4o | 128K tokens | $2.50 | Cannot process (exceeds limit) |
| Claude 3.5 Sonnet | 200K tokens | $3.00 | Cannot process (exceeds limit) |
| Gemini 1.5 Pro | 1M tokens | $1.25 | Cannot process (exceeds limit) |
| Gemini 1.5 Pro 2.0 | 2M tokens | $1.25 | Approx. $3.75/request |
💡 As you can see, the context window of most Large Language Models simply can't accommodate 60,000 rows of Excel data. Even if you try to force it with a Gemini 2M context Large Language Model, each request would still cost about $3.75.
3. 4 Correct Solutions for AI Processing Large Excel Datasets
Now that we understand the root causes, let's dive into 4 tested solutions, ranked by recommendation.
<line x1="0" y1="56" x2="194" y2="56" stroke="#059669" stroke-width="1" opacity="0.5"/>

<text x="0" y="74" font-size="11" font-weight="bold" fill="#34d399">Steps</text>
<rect x="0" y="80" width="194" height="18" rx="4" fill="#022c22"/>
<text x="8" y="93" font-size="9.5" fill="#6ee7b7">Extract 10 rows of sample data for the AI</text>
<rect x="0" y="102" width="194" height="18" rx="4" fill="#022c22"/>
<text x="8" y="115" font-size="9.5" fill="#6ee7b7">AI understands structure, generates analysis scripts</text>
<rect x="0" y="124" width="194" height="18" rx="4" fill="#022c22"/>
<text x="8" y="137" font-size="9.5" fill="#6ee7b7">Run the script locally to process all data</text>

<line x1="0" y1="152" x2="194" y2="152" stroke="#059669" stroke-width="1" opacity="0.5"/>

<text x="0" y="170" font-size="11" font-weight="bold" fill="#34d399">Applicable Scenarios</text>
<text x="0" y="186" font-size="10" fill="#a7f3d0">Data volume > 10,000 rows</text>
<text x="0" y="200" font-size="10" fill="#a7f3d0">Statistical Analysis / Report Generation</text>

<rect x="0" y="214" width="194" height="26" rx="6" fill="#065f46" stroke="#10b981" stroke-width="1.5"/>
<text x="97" y="231" font-size="11" font-weight="bold" fill="#34d399" text-anchor="middle">Token consumption: < 2,000</text>
<line x1="0" y1="56" x2="194" y2="56" stroke="#3b82f6" stroke-width="1" opacity="0.5"/>

<text x="0" y="74" font-size="11" font-weight="bold" fill="#93c5fd">Steps</text>
<rect x="0" y="80" width="194" height="18" rx="4" fill="#1e3a5f"/>
<text x="8" y="93" font-size="9.5" fill="#93c5fd">Split into multiple sub-files by line</text>
<rect x="0" y="102" width="194" height="18" rx="4" fill="#1e3a5f"/>
<text x="8" y="115" font-size="9.5" fill="#93c5fd">Loop through API calls to process each batch</text>
<rect x="0" y="124" width="194" height="18" rx="4" fill="#1e3a5f"/>
<text x="8" y="137" font-size="9.5" fill="#93c5fd">Summarize the results of each batch</text>

<line x1="0" y1="152" x2="194" y2="152" stroke="#3b82f6" stroke-width="1" opacity="0.5"/>

<text x="0" y="170" font-size="11" font-weight="bold" fill="#93c5fd">Applicable Scenarios</text>
<text x="0" y="186" font-size="10" fill="#bfdbfe">5,000-20,000 rows of data</text>
<text x="0" y="200" font-size="10" fill="#bfdbfe">Line-by-line classification / Sentiment analysis</text>

<rect x="0" y="214" width="194" height="26" rx="6" fill="#1e3a5f" stroke="#3b82f6" stroke-width="1.5"/>
<text x="97" y="231" font-size="11" font-weight="bold" fill="#93c5fd" text-anchor="middle">Total cost approximately $0.5-1.5</text>
<line x1="0" y1="56" x2="194" y2="56" stroke="#a855f7" stroke-width="1" opacity="0.5"/>

<text x="0" y="74" font-size="11" font-weight="bold" fill="#d8b4fe">Operation Steps</text>
<rect x="0" y="80" width="194" height="18" rx="4" fill="#3b0764"/>
<text x="8" y="93" font-size="9.5" fill="#d8b4fe">1. Excel Pivot Table for aggregate statistics</text>
<rect x="0" y="102" width="194" height="18" rx="4" fill="#3b0764"/>
<text x="8" y="115" font-size="9.5" fill="#d8b4fe">② Summarize data (dozens of rows) for AI</text>
<rect x="0" y="124" width="194" height="18" rx="4" fill="#3b0764"/>
<text x="8" y="137" font-size="9.5" fill="#d8b4fe">AI writes analysis reports and insights</text>

<line x1="0" y1="152" x2="194" y2="152" stroke="#a855f7" stroke-width="1" opacity="0.5"/>

<text x="0" y="170" font-size="11" font-weight="bold" fill="#d8b4fe">Applicable Scenarios</text>
<text x="0" y="186" font-size="10" fill="#e9d5ff">Need overall trend analysis report</text>
<text x="0" y="200" font-size="10" fill="#e9d5ff">No need to understand the raw data line by line</text>

<rect x="0" y="214" width="194" height="26" rx="6" fill="#3b0764" stroke="#a855f7" stroke-width="1.5"/>
<text x="97" y="231" font-size="11" font-weight="bold" fill="#d8b4fe" text-anchor="middle">Token consumption: minimal</text>
<line x1="0" y1="56" x2="194" y2="56" stroke="#f97316" stroke-width="1" opacity="0.5"/>

<text x="0" y="74" font-size="11" font-weight="bold" fill="#fdba74">Recommended models</text>
<rect x="0" y="80" width="194" height="18" rx="4" fill="#431407"/>
<text x="8" y="93" font-size="9.5" fill="#fdba74">Gemini 2.0 Flash (1M context window)</text>
<rect x="0" y="102" width="194" height="18" rx="4" fill="#431407"/>
<text x="8" y="115" font-size="9.5" fill="#fdba74">Gemini 1.5 Pro (1M context window)</text>
<rect x="0" y="124" width="194" height="18" rx="4" fill="#431407"/>
<text x="8" y="137" font-size="9.5" fill="#fdba74">Claude 3.5 Sonnet (200K)</text>

<line x1="0" y1="152" x2="194" y2="152" stroke="#f97316" stroke-width="1" opacity="0.5"/>

<text x="0" y="170" font-size="11" font-weight="bold" fill="#fdba74">Applicable Scenarios</text>
<text x="0" y="186" font-size="10" fill="#fed7aa">Data volume < 5000 rows</text>
<text x="0" y="200" font-size="10" fill="#fed7aa">Can afford higher API costs</text>

<rect x="0" y="214" width="194" height="26" rx="6" fill="#431407" stroke="#f97316" stroke-width="1.5"/>
<text x="97" y="231" font-size="11" font-weight="bold" fill="#fdba74" text-anchor="middle">Cost: $1-5 / time</text>
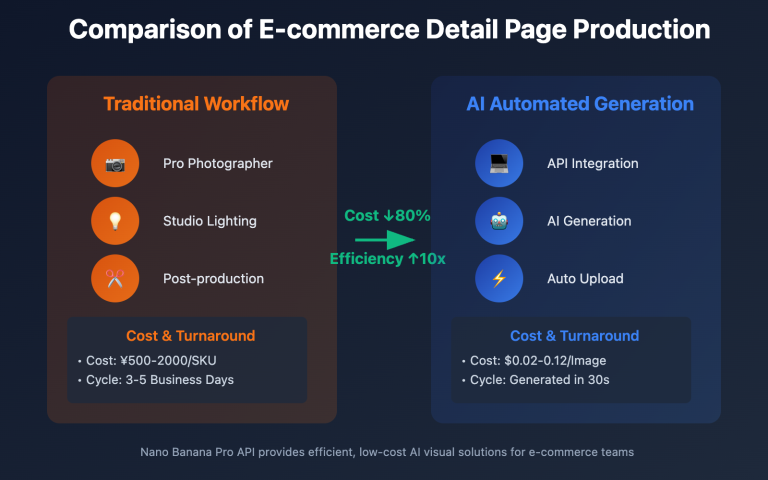
Solution A (Highly Recommended): Sample Data + Let AI Write the Script
The core idea here is not to have the AI process the entire dataset directly. Instead, you let the AI understand your data's structure, and then it generates a processing script that you can run locally.
Steps:
Step One: Extract Sample Data (10 rows are enough)
import pandas as pd

# Read the first 10 rows as a sample (including headers)
df_sample = pd.read_excel("your_data.xlsx", nrows=10)

# Output in text format for easy copying to AI
print(df_sample.to_string())
print("\n--- Data Overview ---")
print(f"Total rows: {len(pd.read_excel('your_data.xlsx'))}")
print(f"Column names: {list(df_sample.columns)}")
print(f"Data types:\n{df_sample.dtypes}")
Step Two: Send the Sample Data and Your Requirements to the AI
Example prompt:
Here are the first 10 rows of my Excel data sample and its structure description:

[Paste the output from the previous step here]

The total dataset has 60,000 rows. I need to analyze the following:
1. Calculate the process completion rate by department.
2. Identify process nodes where the average processing time exceeds 2 hours.
3. Generate a weekly trend report.

Please write me a Python script that reads the complete data and outputs the analysis results.
Step Three: Run the AI-Generated Script Locally
Based on your 10-row sample data, the AI will understand the field meanings and generate a complete analysis script. You'll then run this script locally to process the full 60,000 rows of data. The best part? This entire process won't require any further AI model invocation, meaning zero token consumption.
Solution Advantages:
- Extremely low token consumption (just 10 sample rows ≈ a few hundred tokens)
- Local script can be run repeatedly; just re-run it directly after data updates
- Ideal for scenarios requiring regular processing of similar data
🎯 Recommended Tools: Use APIYI (apiyi.com) to invoke Claude 3.5 Sonnet or GPT-4o for generating data processing scripts. These models excel at code generation tasks, and a single request typically consumes no more than 2,000 tokens, making the cost extremely low.
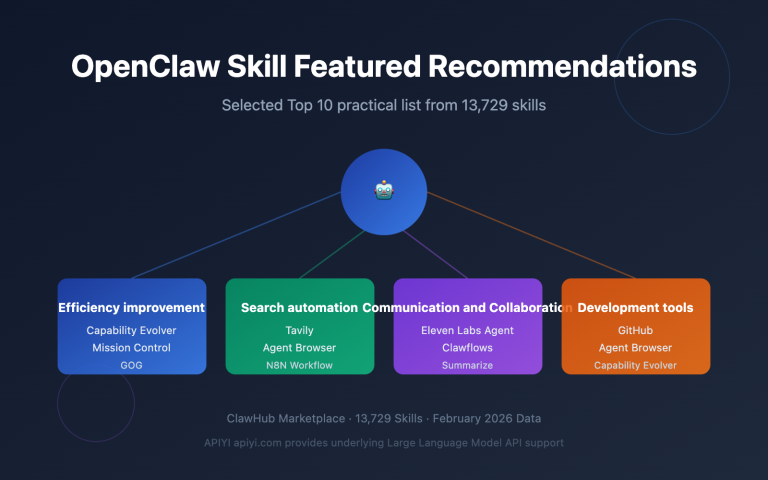
Solution B: Batch Data Processing
Use Case: This is suitable for datasets with 5,000 to 20,000 rows, especially when the AI needs to understand the content of each individual row (e.g., for sentiment analysis or text classification).
Steps:
import pandas as pd

def process_in_batches(file_path, batch_size=500):
    """Process large Excel files in batches"""
    df = pd.read_excel(file_path)
    total_rows = len(df)
    results = []

    for start in range(0, total_rows, batch_size):
        end = min(start + batch_size, total_rows)
        batch = df.iloc[start:end]

        # Convert this batch of data to CSV text and send it to the AI for processing
        batch_text = batch.to_csv(index=False)
        print(f"Processing rows {start+1}-{end} (out of {total_rows} total rows)")

        # Call AI API here to process batch_text
        # result = call_ai_api(batch_text)
        # results.append(result)

    return results
Each batch of 500 rows consumes approximately 25,000-40,000 tokens. Processing a full 60,000-row dataset with GPT-4o mini would cost around $0.5-$1.5 in total.
Important Notes:
- You'll need to aggregate results after each batch. Be mindful of statistical accuracy across batches.
- Batch processing might lose cross-row relationships, so it's best for tasks where rows are independent.
Solution C: Pre-process Data Before Uploading
Use Case: This is ideal when you need the AI to analyze overall trends and write analytical reports, but it doesn't need to see every single raw data row.
Steps:
Step 1: Create Data Summaries Using Excel Pivot Tables or Python
import pandas as pd

df = pd.read_excel("data.xlsx")

# Generate summary statistics
summary = {
    "Total rows": len(df),
    "Time range": f"{df['日期'].min()} to {df['日期'].max()}",
    "Statistics by department": df.groupby('部门')['完成率'].mean().to_dict(),
    "Monthly trend": df.groupby(df['日期'].dt.month)['处理时长'].mean().to_dict(),
    "Number of anomalous data points": len(df[df['处理时长'] > 120])
}

# Convert the summary to structured text and send it to the AI for report writing
import json
print(json.dumps(summary, ensure_ascii=False, indent=2))
Step 2: Provide the Summary Data to the AI for Report Writing
Summary data is usually only a few hundred lines long, so sending it to the AI consumes very few tokens. Despite that, it enables the AI to generate comprehensive trend analyses and business insight reports.
Solution D: Choose an Ultra-Large Context Model
Use Case: This is for situations where you genuinely need the AI to understand the semantic content of the entire dataset and are willing to bear higher costs.
| Model | Max Context | Suitable Data Volume | Estimated Cost |
|---|---|---|---|
| Gemini 1.5 Pro | 1M tokens | Approx. 20k-30k rows | Pay-as-you-go via APIYI |
| Gemini 2.0 Flash | 1M tokens | Approx. 20k-30k rows | Good value for money |
| Claude 3.5 Sonnet | 200k tokens | Approx. 3k-5k rows | Excellent code generation quality |
💡 Even when using ultra-large context models, we strongly recommend cleaning your data first (delete empty rows, merge duplicate columns, remove irrelevant fields). This reduces token consumption and helps avoid hitting pre-payment limits.
🎯 Unified API Advantage: With the APIYI (apiyi.com) platform, you can use a single, unified API interface to invoke various large context models like Gemini, Claude, and GPT. There's no need to register separate accounts for each model, making it easy to switch quickly and compare costs.
IV. How to Avoid Common Pitfalls
Now that you've got a handle on the solutions above, here are some best practices for processing data with AI in your daily work.
<!-- Arrow -->
<line x1="182" y1="38" x2="182" y2="52" stroke="#ef4444" stroke-width="1.5" stroke-dasharray="4,3"/>
<polygon points="176,50 188,50 182,56" fill="#ef4444"/>

<!-- Step 2 -->
<rect x="0" y="56" width="364" height="38" rx="7" fill="#2d1414" stroke="#ef4444" stroke-width="1"/>
<text x="22" y="70" font-size="11" font-weight="bold" fill="#fca5a5">📊 Token volume surged: ≈ 3 million tokens</text>
<text x="22" y="86" font-size="10" fill="#ef4444">60,000 rows × 10 columns × 5 tokens ≈ 3,000,000 tokens</text>

<!-- Arrow -->
<line x1="182" y1="94" x2="182" y2="108" stroke="#ef4444" stroke-width="1.5" stroke-dasharray="4,3"/>
<polygon points="176,106 188,106 182,112" fill="#ef4444"/>

<!-- Step 3 -->
<rect x="0" y="112" width="364" height="38" rx="7" fill="#3d0808" stroke="#dc2626" stroke-width="2"/>
<text x="22" y="126" font-size="12" font-weight="bold" fill="#ff6b6b">💥 API error 402: Insufficient balance</text>
<text x="22" y="142" font-size="10" fill="#fca5a5">Withholding $9.00 > Account balance $5.20 → Request failed</text>

<!-- Problem stats -->
<rect x="0" y="162" width="174" height="54" rx="7" fill="#1a0505" stroke="#ef4444" stroke-width="1"/>
<text x="87" y="180" font-size="10" fill="#fca5a5" text-anchor="middle">Token consumption</text>
<text x="87" y="202" font-size="22" font-weight="bold" fill="#ef4444" text-anchor="middle">3 million</text>

<rect x="186" y="162" width="178" height="54" rx="7" fill="#1a0505" stroke="#ef4444" stroke-width="1"/>
<text x="275" y="180" font-size="10" fill="#fca5a5" text-anchor="middle">Analysis results</text>
<text x="275" y="202" font-size="18" font-weight="bold" fill="#ef4444" text-anchor="middle">Failed to complete</text>

<!-- Cost label -->
<rect x="0" y="228" width="364" height="28" rx="6" fill="#2d0808" stroke="#dc2626" stroke-width="1.5"/>
<text x="182" y="246" font-size="12" font-weight="bold" fill="#ff6b6b" text-anchor="middle">Estimated cost: $7.5+ · and exceeded the context window limit</text>
<!-- Arrow -->
<line x1="182" y1="38" x2="182" y2="52" stroke="#10b981" stroke-width="1.5" stroke-dasharray="4,3"/>
<polygon points="176,50 188,50 182,56" fill="#10b981"/>

<!-- Step 2 -->
<rect x="0" y="56" width="364" height="38" rx="7" fill="#022c22" stroke="#10b981" stroke-width="1"/>
<text x="22" y="70" font-size="11" font-weight="bold" fill="#6ee7b7">AI understands structure, generates analytical Python scripts</text>
<text x="22" y="86" font-size="10" fill="#34d399">Consumes approximately 1,500-2,000 tokens to complete script generation</text>

<!-- Arrow -->
<line x1="182" y1="94" x2="182" y2="108" stroke="#10b981" stroke-width="1.5" stroke-dasharray="4,3"/>
<polygon points="176,106 188,106 182,112" fill="#10b981"/>

<!-- Step 3 -->
<rect x="0" y="112" width="364" height="38" rx="7" fill="#064e3b" stroke="#059669" stroke-width="2"/>
<text x="22" y="126" font-size="12" font-weight="bold" fill="#34d399">🚀 Run script locally to process the complete 60,000 rows of data</text>
<text x="22" y="142" font-size="10" fill="#a7f3d0">The script executes locally, and results are saved to analysis.xlsx</text>

<!-- Success stats -->
<rect x="0" y="162" width="174" height="54" rx="7" fill="#021a0d" stroke="#10b981" stroke-width="1"/>
<text x="87" y="180" font-size="10" fill="#6ee7b7" text-anchor="middle">Token consumption</text>
<text x="87" y="202" font-size="22" font-weight="bold" fill="#34d399" text-anchor="middle">~2000</text>

<rect x="186" y="162" width="178" height="54" rx="7" fill="#021a0d" stroke="#10b981" stroke-width="1"/>
<text x="275" y="180" font-size="10" fill="#6ee7b7" text-anchor="middle">Analysis results</text>
<text x="275" y="202" font-size="18" font-weight="bold" fill="#34d399" text-anchor="middle">✅ Complete and accurate</text>

<!-- Cost label -->
<rect x="0" y="228" width="364" height="28" rx="6" fill="#064e3b" stroke="#059669" stroke-width="1.5"/>
<text x="182" y="246" font-size="12" font-weight="bold" fill="#34d399" text-anchor="middle">Actual cost: < $0.01 · Script can be reused repeatedly</text>
Token Estimation Method Before Use
Before uploading your files, you can quickly estimate the token count using the following method:
import pandas as pd

def estimate_tokens(file_path):
    """Roughly estimates the number of tokens after converting an Excel file to text."""
    df = pd.read_excel(file_path)

    # Convert data to CSV text
    csv_text = df.to_csv(index=False)

    # Rough estimate: English ~4 chars/token, Chinese ~1.5 chars/token
    char_count = len(csv_text)
    estimated_tokens = char_count / 3.5  # Average for mixed English/Chinese

    print(f"Number of rows: {len(df)}")
    print(f"Number of columns: {len(df.columns)}")
    print(f"CSV character count: {char_count:,}")
    print(f"Estimated Token count: {estimated_tokens:,.0f}")
    print(f"Estimated cost with GPT-4o ($2.5/1M): ${estimated_tokens/1_000_000*2.5:.4f}")

    if estimated_tokens > 100_000:
        print("⚠️ Warning: Token count exceeds 100,000. Consider using Solution A (sample + script).")

estimate_tokens("your_data.xlsx")
Common Errors and Solutions Reference Table
| Error Symptom | Root Cause | Solution |
|---|---|---|
| Reports "insufficient balance" but balance exists | Token pre-deduction exceeds account balance | Recharge balance or switch to Solution A/C |
| Very slow response or timeout | Too many input tokens, long inference time | Reduce input data volume |
| AI analysis results are inaccurate | Too much data, "lost-in-the-middle" effect | Streamline data, use batch processing |
| API reports context length exceeded | Exceeded model's maximum context window | Switch to a Large Language Model with a larger context window or use batch processing |
| Very high cost per request | Large amounts of data repeatedly uploaded | Use Solution A to generate a reusable local script |
V. Hands-on Practice: Analyzing 60,000 Rows of Process Data
Let's walk through a complete business case, demonstrating the entire process from encountering issues to resolving them.
Background: The operations team has a 60,000-row dataset on process efficiency. It includes fields like department, process name, start time, end time, handler, and completion status. They want AI to analyze which process nodes are the least efficient.
Step 1: Extract a Sample
import pandas as pd

# Read the first 10 rows
df = pd.read_excel("process_data.xlsx", nrows=10)
print("=== Data Sample (First 10 Rows) ===")
print(df.to_string())

print("\n=== Field Descriptions ===")
for col in df.columns:
    print(f"- {col}: {df[col].dtype}, Sample Value: {df[col].iloc[0]}")
Step 2: Send to AI, Get Analysis Script
Send the above output to the AI, along with the requirements:
Here's the structure and 10-row sample of my Excel process data:

[Paste output content here]

Requirements:
1. Calculate the average processing time for each "流程名称" (End Time - Start Time).
2. Calculate the process completion rate by department (proportion of "完成状态" that is "完成").
3. Identify the top 10 processes by average processing time and output them as a table.
4. Save the results to analysis_result.xlsx.

Please write a complete, runnable Python script.
Step 3: Run the Script Locally
The AI will generate an analysis script similar to the following (simplified example):
import pandas as pd

# Read the full data
df = pd.read_excel("process_data.xlsx")

# Calculate processing time (minutes)
df['Processing_Time_Minutes'] = (
    pd.to_datetime(df['结束时间']) - pd.to_datetime(df['开始时间'])
).dt.total_seconds() / 60

# Calculate average duration by process
process_avg = (
    df.groupby('流程名称')['Processing_Time_Minutes']
    .agg(['mean', 'count'])
    .rename(columns={'mean': 'Average_Duration', 'count': 'Total_Count'})
    .sort_values('Average_Duration', ascending=False)
)

# Calculate completion rate by department
dept_completion = (
    df.groupby('部门')['完成状态']
    .apply(lambda x: (x == '完成').mean() * 100)
    .round(2)
    .rename('Completion_Rate%')
)

# Output Top 10 slowest processes
print("=== Top 10 Slowest Process Nodes ===")
print(process_avg.head(10).to_string())

# Save results
with pd.ExcelWriter("analysis_result.xlsx") as writer:
    process_avg.to_excel(writer, sheet_name="Process_Efficiency_Analysis")
    dept_completion.to_excel(writer, sheet_name="Department_Completion_Rate")

print("\n✅ Analysis results saved to analysis_result.xlsx")
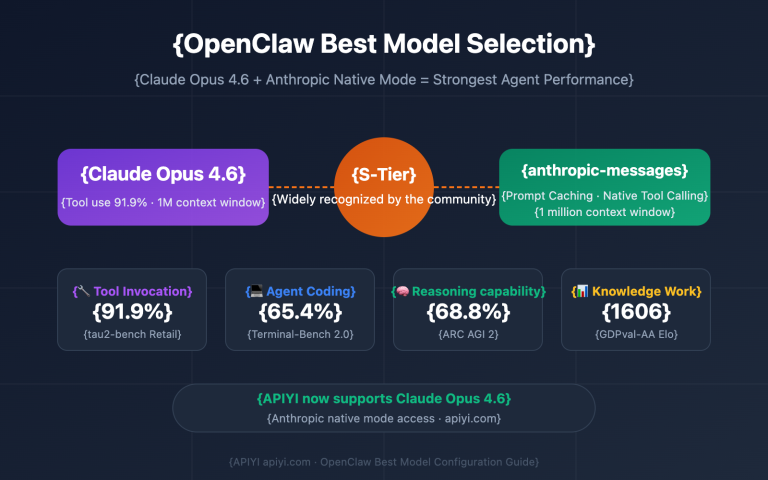
Token Consumption Comparison for the Entire Process:
| Method | Token Consumption | Estimated Cost (GPT-4o) | Analysis Quality |
|---|---|---|---|
| Directly upload 60k rows | ~3 million tokens | $7.5+ and exceeds context window | Cannot complete |
| Approach A (Sample + Script) | ~2,000 tokens | < $0.01 | Complete and accurate |
🎯 Cost Comparison: Approach A consumes less than 0.1% of the direct upload method, and the analysis results are more accurate and reusable. We recommend using APIYI (apiyi.com) to call GPT-4o or Claude 3.5 Sonnet for generating data processing scripts; the results are excellent, and the cost is extremely low.
VI. Frequently Asked Questions (FAQ)
Q1: I don't have a Python background. Can I still use this approach?
Absolutely! The core of Approach A is "letting AI write the script, and you run it." You just need to:
- Install Python (from python.org; just click "next" through the installer).
- Install pandas: Type
pip install pandas openpyxlin your terminal. - Extract sample data for the AI → AI generates the script → Save it as a
.pyfile → Double-click to run.
For users unfamiliar with the command line, you can also use Jupyter Notebook (included with Anaconda), which is more visual.
💡 On APIYI (apiyi.com), you can also use the built-in code interpreter feature to let AI directly generate and validate script logic, reducing debugging time.
Q2: Besides Python, are there other ways to handle big data?
Yes, here are a few methods, ordered by ease of use:
- Excel's built-in features: PivotTables + Power Query. No programming needed, great for aggregate statistics.
- Python pandas: Most flexible, highly efficient for processing, recommended for intermediate to advanced users.
- Microsoft Copilot (Excel add-in): Analyze data directly within Excel by conversing with AI, but it still has row limitations.
- Professional data analysis tools: Tableau, Power BI. Connect to data sources and offer strong big data processing capabilities.
Q3: How much account balance is appropriate to avoid pre-deduction errors?
This depends on your daily usage scenario. Generally, we recommend:
- Regular chat users: Maintain a $5-20 balance.
- Data processing users (occasional file uploads): Maintain a $20-50 balance.
- High-frequency API calls: Consider setting up auto-recharge or maintaining a $100+ balance.
🎯 Balance Management: On the APIYI (apiyi.com) console, you can view token consumption details, set usage alerts, and prevent business interruptions due to insufficient balance. The platform supports on-demand top-ups with no minimum consumption requirements.
Q4: My data involves privacy. Can I send sample data to the AI?
Here are reasonable approaches:
- Anonymize before sending to AI: Replace sensitive fields like names, phone numbers, and ID numbers with sample values (e.g., "Zhang San" → "User A").
- Provide only field names and data types: Don't give specific values; just tell the AI the field structure and data types.
- Local model solution: Use Ollama to run a local model (e.g., Qwen2.5), so data never leaves your machine.
Summary
The most common pitfall when AI processes large Excel datasets is directly uploading the entire file, which often leads to token explosions, API errors, and uncontrolled costs. The core solution is quite simple:
Let AI "see samples, write scripts," rather than "see everything, do calculations."
Here's a quick overview of the applicable scenarios for the four solutions:
| Scenario | Recommended Solution | Difficulty |
|---|---|---|
| Data volume > 10,000 rows, requires statistical analysis | Solution A: Sample + Script | ⭐⭐ (Requires running Python) |
| Data volume 5,000-20,000 rows, requires row-by-row understanding | Solution B: Batch Processing | ⭐⭐⭐ (Requires API calls) |
| Only needs trend reports, no row-by-row analysis | Solution C: Pre-processed Summary | ⭐ (Can be done with Excel) |
| Data volume < 5,000 rows, can bear higher costs | Solution D: Large Context Model | ⭐ (Direct upload) |
Try Solution A now: Extract the first 10 rows of your Excel file, then on APIYI apiyi.com, select GPT-4o or Claude 3.5 Sonnet. Tell the AI your analysis requirements and let it generate a processing script—most data analysis tasks can be completed for less than $0.01.
🎯 Quick Start: Visit APIYI apiyi.com and register to experience various mainstream models. It supports unified API calls for OpenAI, Claude, Gemini, and more, billed based on actual usage, with no monthly fees or minimum consumption. It's suitable for business teams and individual users to handle various data analysis tasks.
This article was compiled by the APIYI technical team, based on real user feedback and practical experience. If you have any questions or suggestions, please feel free to contact us via apiyi.com.