
Author’s note: This article breaks down how Flint-interactive uses “semantic events + update operations” to reduce the cost and error rate of agent-generated interactive charts, and explores three integration paths.
If you’re building an AI agent for data analysis or reporting, you’ve probably run into this: an agent can quickly create a static chart, but add “click to filter” or “brush to link,” and it takes several rounds of revisions. The layout breaks, highlighting stops working, and fixing one thing breaks another. Before long, you’ve spent the time and tokens on debugging.
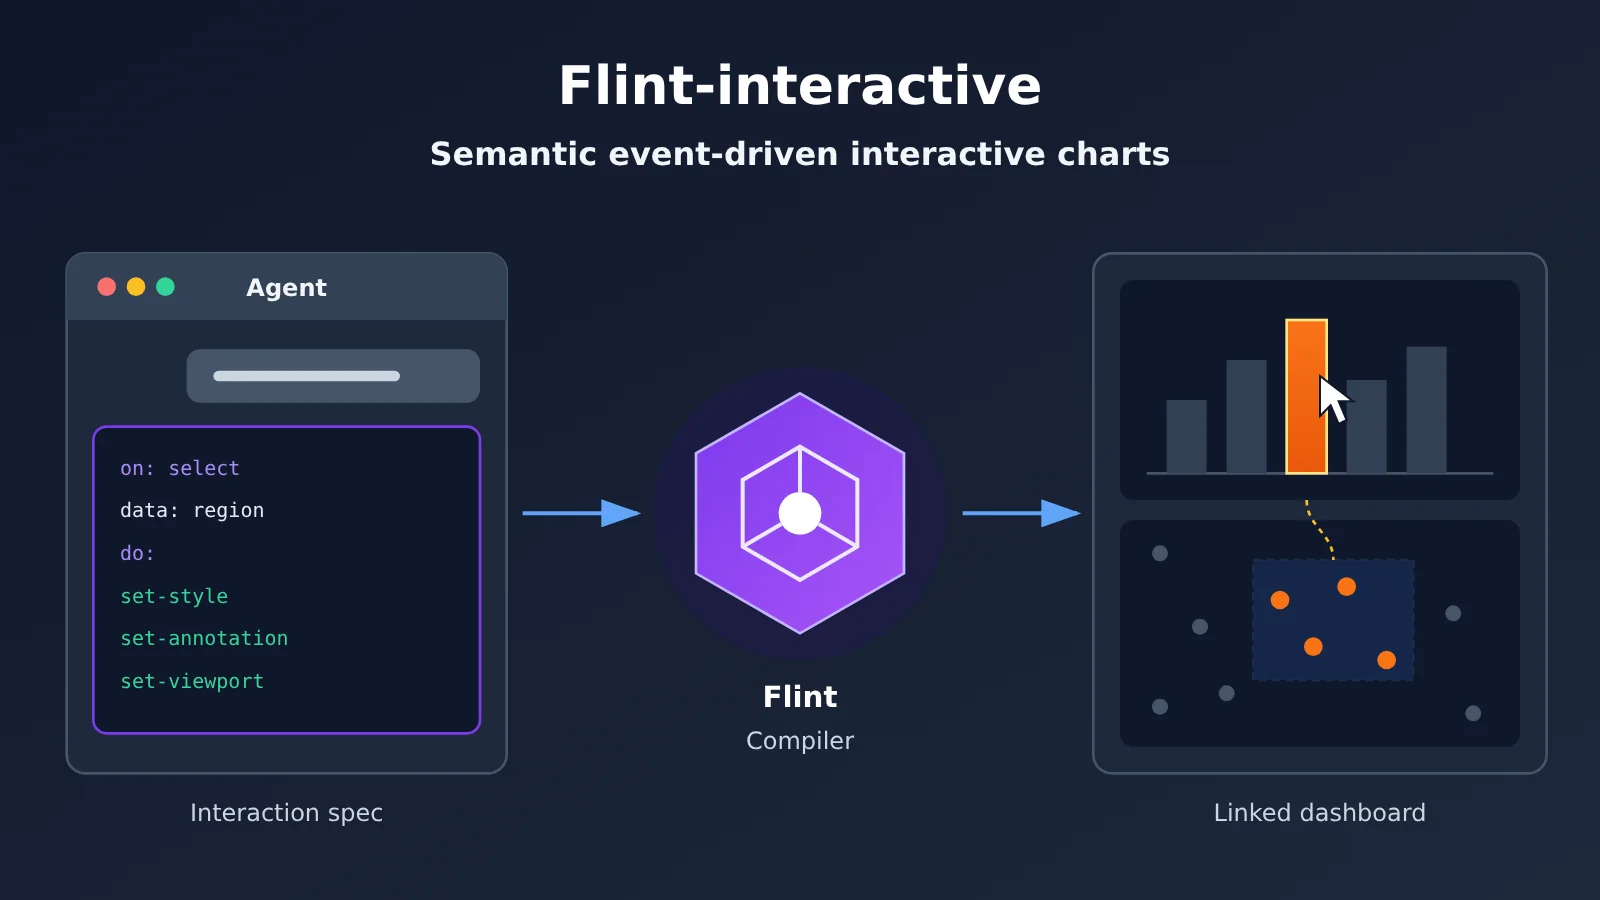
Microsoft Research released Flint-interactive on October 22, 2026. It’s an interactive data visualization language built on Flint. This article isn’t recommending a new charting library. Instead, it uses Flint-interactive as a case study in designing high-level output specifications for agents so they can write less low-level rendering code.
What you’ll learn: By the end, you’ll understand the cost and reliability bottlenecks agents face when generating interactive charts, the design principle of “letting the compiler handle visual logic while describing interaction logic with semantic events,” and when to use each of the three integration paths: in-conversation, in-app, and custom interactions.
Why having an agent write interactive code without Flint-interactive is costly
Having an agent write interactive chart code directly looks like the most flexible option. But the research blog points out two clear bottlenecks in practice, even with powerful frontier models.
The first is high generation costs. An agent rarely delivers a satisfactory interactive chart in one pass. It usually takes multiple rounds of reasoning, coding, and debugging, each consuming tokens and time. The second is poor reliability. Interactive visualizations are inherently complex: expressive charts can easily develop layout issues or broken interactions, and fixing them can introduce new bugs.
So what about using a chart library’s built-in interactions? The blog argues that some visualization libraries don’t offer enough expressive power to create customized interactive charts. What’s missing, ultimately, is an interaction description language that’s both expressive and sufficiently high-level.
| Approach | What the agent needs to output | Main issue | Suitability |
|---|---|---|---|
| Write low-level rendering code directly | Event listeners, hit detection, redraw logic | Multiple debugging rounds, high token consumption, risk of introducing new bugs | Most expressive, but less reliable |
| Use only built-in chart library interactions | Toggle a few configuration options | Limited interaction types, difficult to customize | Reliable, but not expressive enough |
| Flint-interactive specifications | Mappings from semantic events to update operations | Requires learning a new specification system | Balances expressiveness and reliability |
If you need to switch models frequently for these multi-round generation tasks, you can access multiple leading models through the unified API from APIYI at apiyi.com. Use the same invocation code to compare the number of rounds and resource consumption across models, and find out how costly the low-level coding approach really is for your use case.
Flint-interactive: Key Takeaways
| Key point | Description | Value for developers |
|---|---|---|
| Semantic events | The compiler translates raw triggers such as clicks, drags, and keypresses into information about which chart elements and data were selected | Agents don’t need to handle pixel coordinates or hit testing |
| Update operations | High-level operations such as set-style, set-annotation, and set-viewport describe visual changes | No need to manipulate renderer-specific graphical marks |
| Flint Canvas state machine | Tracks user interactions on the canvas and manages rendering state | The framework manages the runtime, reducing state inconsistencies |
| Composability | Both event generation and visual updates are composable and can connect to tables, text, and components | You can build data stories and linked dashboards |
Semantic Events: Flint-interactive Only Cares About “What Data Did the User Select?”
Semantic events are the core concept of Flint-interactive. Traditionally, an agent would have to handle details like “the mouse was pressed at coordinates (x, y) and dragged to another point,” then figure out which data points fell within that area. In Flint, the compiler does that work and produces a meaningful event directly, such as “the user box-selected these country groups.”
Think of it as the difference between native DOM events and business events in frontend development. When writing business logic, you don’t care about the coordinates of a mousedown event; you care that “the user selected order A.” Semantic events bring the same abstraction to visualization, with the compiler ensuring it’s applied correctly.
Update Operations: Flint-interactive Replaces Imperative Redrawing With Declarative Results
Once it receives a semantic event, the interaction logic only needs to answer one question: What should the visualization look like? The update operations listed in the blog include using set style to highlight data, set annotation to label a point, and set viewport to pan or zoom the view.
It’s a bit like the difference between SQL and a handwritten loop. With SQL, you describe the result you want, and the database decides how to execute it. With Flint interactions, you describe which data should be highlighted, and the compiler translates that into concrete canvas changes, including hit testing and low-level visual updates.
State Machine: Flint Canvas Manages the Interaction Runtime
Flint Canvas is essentially a state machine that continuously tracks user interactions on the canvas and manages rendering state. For an agent, that means it doesn’t have to maintain error-prone intermediate state, such as what’s currently selected or whether the previous highlight has been cleared.
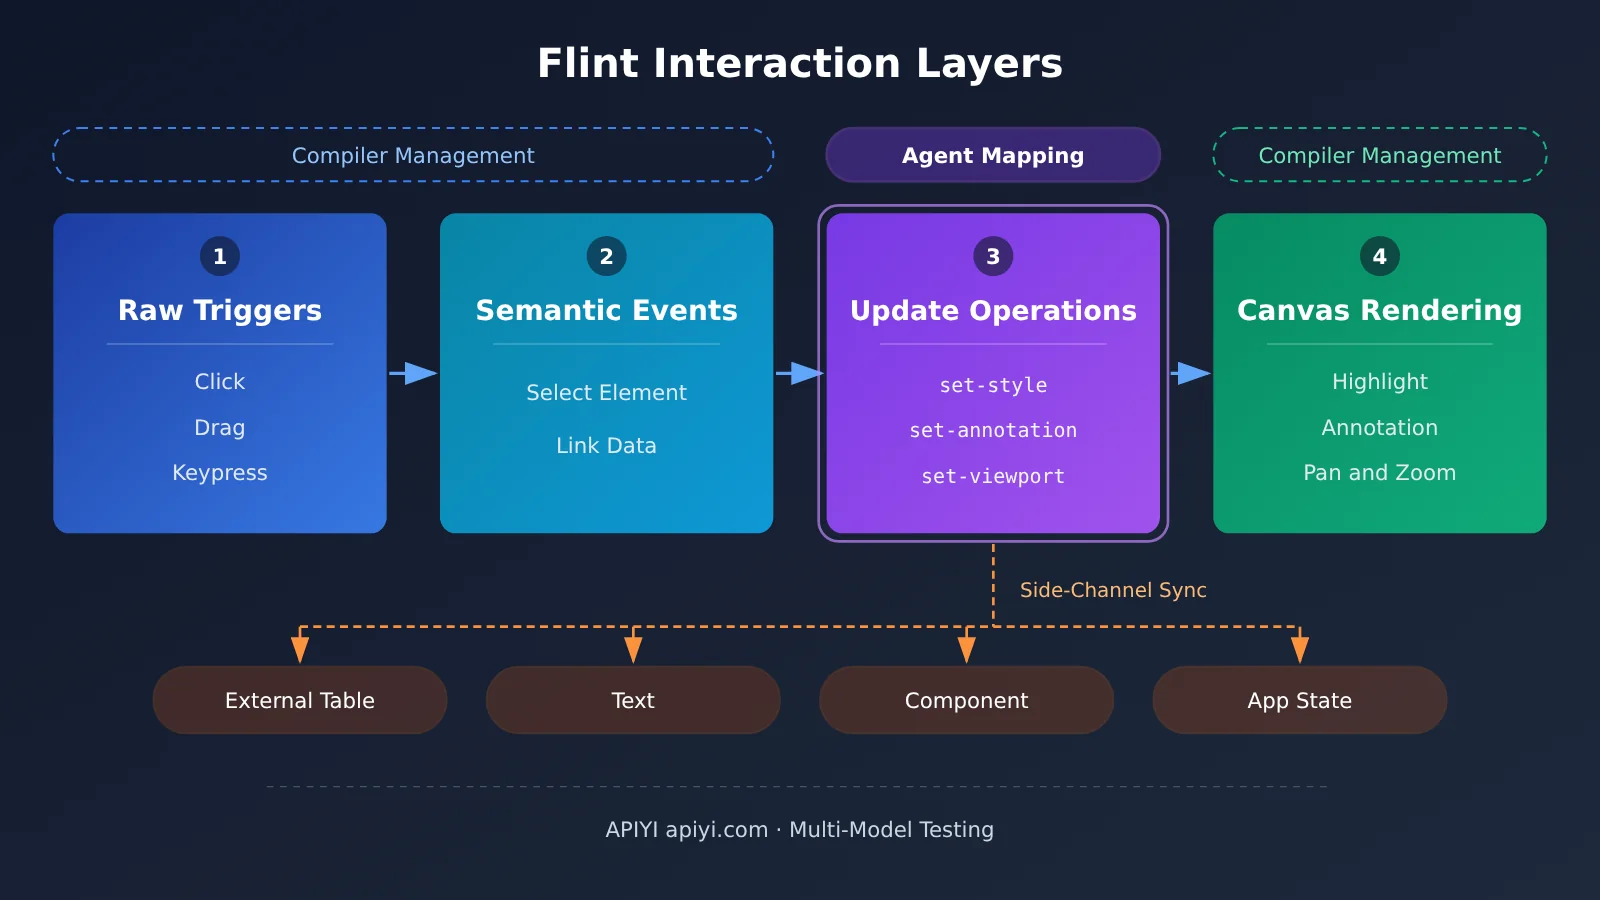
The diagram illustrates the blog’s central distinction: the compiler manages visual logic, while the user describes interaction logic at the semantic level. The agent only handles the mapping in the middle—deciding which events correspond to which updates—while the framework takes care of the two ends, where errors are most likely.
The Transferable Principle Behind Flint-interactive: Design High-Level Output Specifications for Agents
Beyond Flint-interactive itself, the most useful takeaway is an engineering principle: don’t ask an agent to produce the layer it’s most likely to get wrong. Low-level rendering code has complex dependencies and a long feedback loop, so repeated trial and error at that layer is costly.
Another way to look at it: Flint turns an open-ended programming problem into a mapping problem with a limited vocabulary. The agent has a smaller, more structured output space, making its output easier to validate. The same idea applies to workflow orchestration, form generation, report layout, and other tasks.
| Decision factor | Best handled by the agent | Best handled by the compiler or runtime |
|---|---|---|
| Does it express business intent? | Yes, such as “highlight the same group after selecting a country” | No, such as pixel coordinate conversion |
| Does it depend on substantial implicit state? | Few dependencies; a single mapping can describe it | Many dependencies; requires continuous tracking |
| Is it easy to pinpoint errors? | The specification is clearly structured and easy to validate | Rendering details are scattered and hard to debug |
| Is it reusable? | Can be captured as a preset, such as linked-brush | General-purpose infrastructure implemented once |
When designing an output format for your own agent, use this table as a checklist. If a layer expresses intent, has few state dependencies, and is easy to validate, it’s a good fit for agent output. Otherwise, move it into deterministic code or a compiler.
It’s worth noting that the research blog doesn’t provide quantitative data on reduced token consumption or improved success rates. Test the benefits of this design principle on your own tasks rather than assuming the conclusions will carry over.
Getting Started with Flint-interactive: 3 Integration Paths
The blog outlines three ways to use Flint-interactive, aimed at chart users, application developers, and interaction designers. We’ll walk through them from the lightest setup to the most involved.
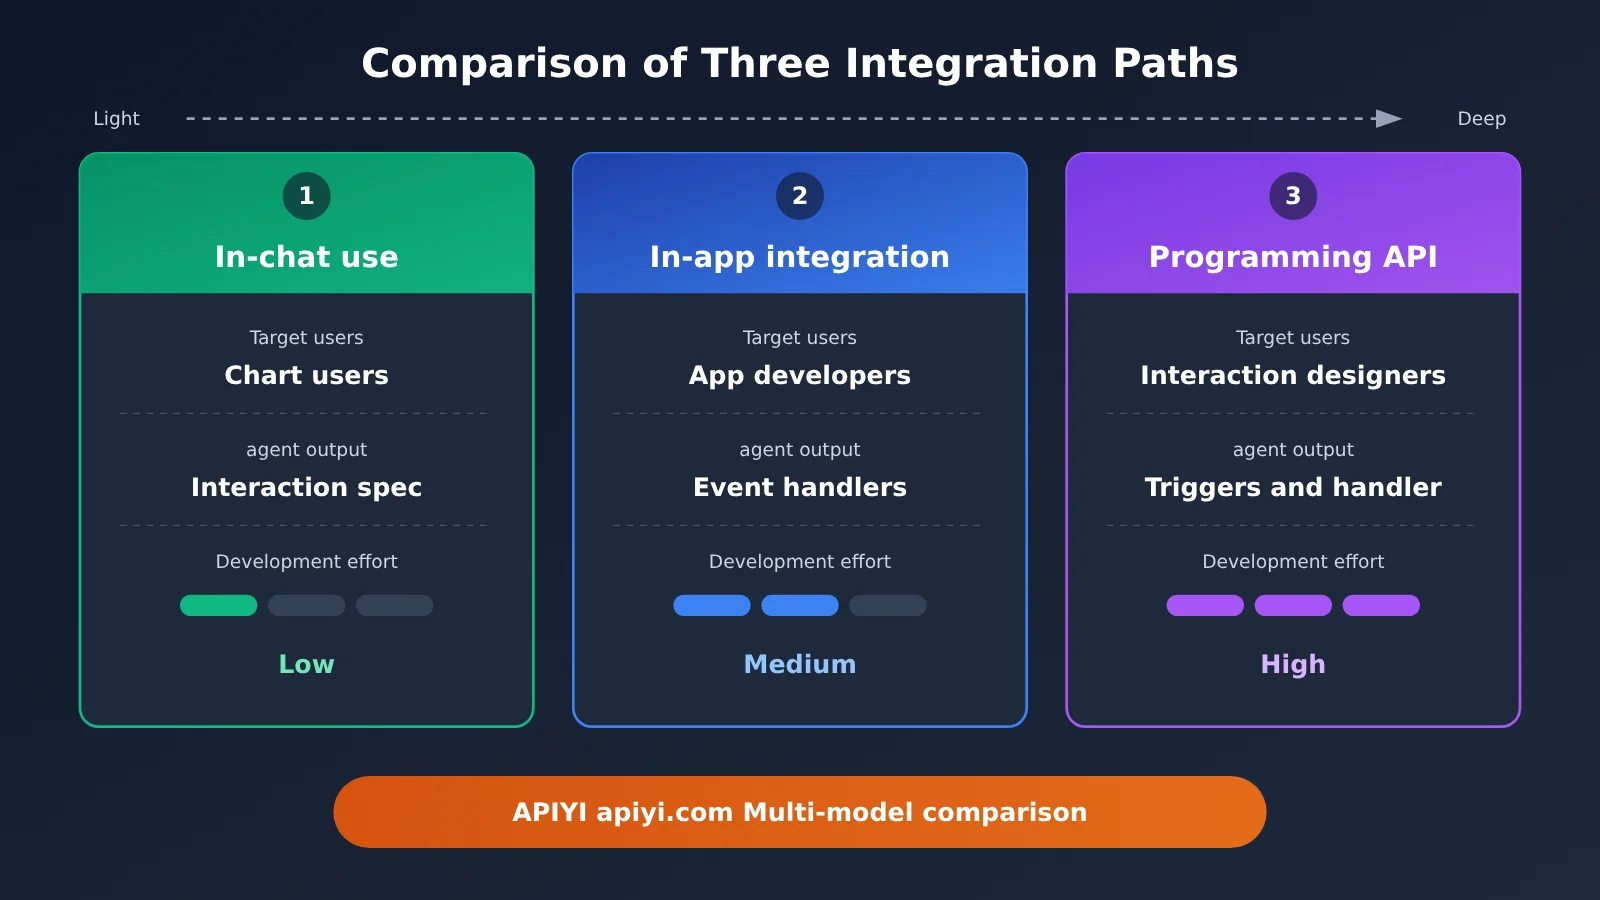
| Integration path | Target users | What the agent or application outputs | Typical scenarios |
|---|---|---|---|
| In conversation (Flint-MCP + MCP Apps) | Chart users | Flint chart specification + interaction_spec |
Explore data in chat and use selections in follow-up questions |
| In an application (Flint Interactive Canvas) | Application developers | Semantic event handlers + update operations sent to Canvas | Dashboards, data stories, and linked charts and tables |
| Custom interactions (programming API) | Interaction designers | A trigger + a custom handle function | Custom interactions beyond the presets, such as DimpVis |
Path 1: Use Flint-interactive in a Conversation (MCP)
This is the lightest option. With Flint-MCP and MCP Apps, you can use Flint Interactive directly in a chat or canvas environment. Follow the official MCP setup guide for the configuration details. Once it’s connected, the workflow looks roughly like this:
- Follow the official MCP setup guide to connect Flint-MCP to a chat or canvas environment that supports MCP Apps;
- Tell the agent what chart to create and which interactions you want, such as “support box selection and highlight countries in the same group”;
- The agent generates an
interaction_specalongside the Flint chart specification and renders an interactive chart in the conversation; - Make a selection on the chart. The selected content can be passed as context to subsequent conversation turns.
Step 4 is especially useful. After box-selecting a group of anomalous data points, a user can ask, “Why are these points higher than expected?” The agent receives the structured selection rather than a vague text description.
Path 2: Integrate Flint-interactive Canvas into Your App
To use Flint Interactive Canvas in your own dashboard or data story, you can think of its bidirectional data flow in two directions:
- Chart → App: Flint Canvas emits semantic events that your app receives through event handlers. You can use them to filter a table, update another chart, or change the app’s state;
- App → Chart: When a component in your app needs to control the chart, it can send update operations to Flint Canvas.
The blog’s example shows a chart and table linked in both directions: clicking a table row highlights the corresponding point in the chart, and vice versa. For reporting products, this is the foundation of a coordinated chart-and-table experience. The blog also notes that you can share the interaction-author skill with your coding agent and have it add interaction presets to your app.
Path 3: Create Custom Flint-interactive Interactions with the Programming API
When preset interactions, such as linked-brush selection, aren’t enough, you can use the programming API to define a trigger and a custom handle function that maps semantic events to a series of custom chart updates.
In the blog’s example, clicking a country highlights it and adds a label with its name. The handler combines set-style and set-annotation operations without ever manipulating renderer-specific graphical marks. In a more complex DimpVis example, users can drag a point along a time path to see how temperature and precipitation change across all cities.
🚀 Getting started: First, use Path 1 in a conversation to check whether your data is a good fit for interaction. Then decide whether to invest in Path 2 or Path 3. You can access the models that power your agent through APIYI apiyi.com and switch between several leading models in the same codebase to see which one produces valid
interaction_specoutput most reliably.
Evaluating How Reliably Agents Generate Flint-interactive Specs
The blog doesn’t say which models or agents are better at generating Flint specs, so it’s worth setting up a simple evaluation process before launch. Consider tracking these metrics:
| Metric | How to measure it | What it tells you |
|---|---|---|
| First-attempt success rate | Measure the percentage of first attempts that render and work correctly | Directly reflects generation costs |
| Average repair rounds | Record the number of conversation rounds needed to reach a usable result | Reflects token and time costs |
| Interaction intent accuracy | Manually check whether interactions match the requirements | A valid spec doesn’t necessarily match the intended behavior |
| Regression stability | Check whether other interactions still work after one is modified | Addresses the reliability issue mentioned in the blog |
Try preparing a fixed set of interaction requirements as a test set. Use the same prompts to compare two approaches: “write rendering code directly” and “output a Flint spec.” With a multi-model aggregation interface like APIYI, you can compare multiple models in a single script without integrating each provider’s SDK separately.
Frequently Asked Questions
Q1: What is Flint-interactive?
Flint-interactive is an interactive data visualization language from Microsoft Research, built on Flint. Its compiler translates user interactions into semantic events, then uses high-level update operations to modify charts. This lets users and agents describe interactions—such as clicking, filtering, zooming, highlighting, and linking charts—in concise specifications.
Q2: How is Flint-interactive different from having an agent write chart interaction code directly?
When writing code directly, an agent has to handle events, hit detection, and redrawing all at once. That approach is expressive, but it can require multiple rounds of debugging and is more prone to errors. Flint-interactive leaves the visual logic to the compiler, so the agent only needs to describe which updates correspond to which semantic events. The resulting output is shorter and easier to validate.
Q3: When was Flint-interactive released?
Microsoft Research published a blog post about the research on October 22, 2026. The reference materials don’t specify its open-source license, maturity, or production readiness, so check the official repository for the latest information before using it in a project.
Q4: What use cases is Flint-interactive best suited for?
– **Conversational data analysis**: Select data points in a chat and use the selection in follow-up questions;
– **Reports and dashboards**: Link multiple charts and click a chart to filter a detailed table;
– **Data stories**: Highlight charts and text passages in both directions, creating interactive narratives like those in data journalism.
Q5: How should I set up model invocation when building an agent that uses Flint-interactive?
Flint handles what the agent should output, but you’ll still need to connect a model separately. A convenient option is to access multiple leading models through APIYI at apiyi.com. Use a unified interface to run the same set of interaction requirements, compare how often each model produces a usable specification on the first try and how many revision rounds it needs, then choose one for production.
Q6: How can product leaders decide whether their team should adopt Flint-interactive?
Start with two questions: Do your users really need to explore data through charts? And does your agent currently require a lot of rework to generate interactive charts? If the answer to both is yes, it’s worth running a small-scale validation using approach one. During testing, you can use the APIYI platform to switch models quickly and keep validation costs low.
Q7: What are Flint-interactive’s known limitations or open questions?
– **No quantitative data**: The blog doesn’t provide specific figures for token savings or improved success rates;
– **Unknown model compatibility**: It doesn’t say which models generate Flint specifications most effectively;
– **Limited interaction vocabulary**: Interactions outside the presets must be implemented using the programming API. The team encourages users to submit new presets on GitHub to expand the vocabulary.
Flint-interactive Key Takeaways
- Root cause of the cost: When an agent writes interaction code directly, it often takes multiple rounds of debugging, consumes many tokens, and can introduce new bugs during fixes.
- Semantic events: The compiler translates raw actions like clicks and drags into meaning, such as which data points were selected.
- Update operations: Use set-style, set-annotation, and set-viewport to declare visual changes without touching the underlying rendering code.
- Separation of responsibilities: The compiler handles visual logic, interaction logic is described at the semantic level, and the Canvas state machine manages the runtime.
- Three integration paths: Use MCP in conversations, Canvas in applications, and the programming API for custom interactions.
- Transferable principle: Design high-level output specifications for agents, and delegate the most error-prone layer to a deterministic system.
- Practical validation: Use APIYI’s unified interface to compare multiple models and test how reliably they generate specifications.
Summary
Flint-interactive’s approach to semantic events comes down to three points:
- Accurate diagnosis: Interactive charts are hard to generate not because models aren’t capable enough, but because there’s no interaction language that’s both expressive and high-level enough.
- Clear division of responsibilities: The compiler handles event parsing and visual updates, while the agent only describes the “event → update” mapping.
- Layered integration options: You can start by trying it in a conversation, then move on to application integration and custom interactions as needed.
If you’re building reporting or data analysis agents, you can apply these design principles to rethink your own agent’s output format, even if you’re not ready to use Flint.
When you’re ready to test, try APIYI at apiyi.com to access multiple leading models through a unified interface. Compare their results on the same set of interaction requirements to find the model and specification combination that works best for your use case.
📚 References
- Microsoft Research Blog – Flint-interactive: Official Flint-interactive research blog
- Link:
microsoft.com/en-us/research/blog/flint-interactive-a-language-for-creating-interactive-data-visualizations - Overview: Introduces semantic events, update operations, the Canvas state machine, and three ways to use Flint-interactive: MCP, Canvas, and the programming API. The blog also links to an MCP setup guide, an interactive examples gallery, and the programming API.
Author: APIYI Technical Team
Technical discussion: Visit APIYI at apiyi.com to share practical experience with agents and multi-model integration. For more resources, check out the documentation at docs.apiyi.com.