
Author’s note: When comparing model costs, looking only at the price per million tokens can lead you to the wrong choice. This article explains how to calculate cost using “unit price × actual token consumption” and walks you through testing models on a small sample of your own tasks.
When choosing a model, many teams start with the pricing page. They see that Model A costs just a few cents per million tokens while Model B costs several dollars, and conclude that Model A is cheaper. But the bill at the end of the month often tells a different story—sometimes the “cheaper” model costs more. This article introduces a real-cost calculation based on “unit price × actual token consumption, adjusted for caching”, so you can do the math before choosing a model.
This isn’t another pricing roundup. Price lists go out of date, but the calculation method doesn’t. We’ll turn observations from published cost analyses into a general framework, then show you how to test it on your own tasks.
What you’ll get: By the end, you’ll understand why a lower listed price doesn’t necessarily mean a lower bill, and you’ll be able to use 20 to 50 real requests to measure the cost per task for each candidate model.
Key Takeaways on the True Cost of Models
| Key point | Explanation | Impact on model selection |
|---|---|---|
| Unit price is only one factor | Bill = sum of each token category’s count × its unit price | Comparing unit prices alone means looking at only half the formula |
| Tokenization differences | Different models split the same text into different numbers of tokens | Input costs need to be calculated using each model’s actual token count |
| Reasoning tokens | A reasoning model’s thinking process is usually billed as output, even though users can’t see it | A short visible answer can still result in a high bill |
| Cache hits | Repeated prefixes that hit the cache are billed at a lower cache rate | This can make a significant difference for long system prompts and multi-turn conversations |
| Success rates and retries | Incorrect answers or invalid formats require another run | Effective cost = cost per run ÷ success rate |
Why the Price per Million Tokens Doesn’t Tell You the True Cost
The price per million tokens tells you “how much each token costs,” but your bill tells you “how much it costs to get a task done.” The key variable between the two is how many tokens the task requires. Differences between models on this front are often greater than the differences in unit price.
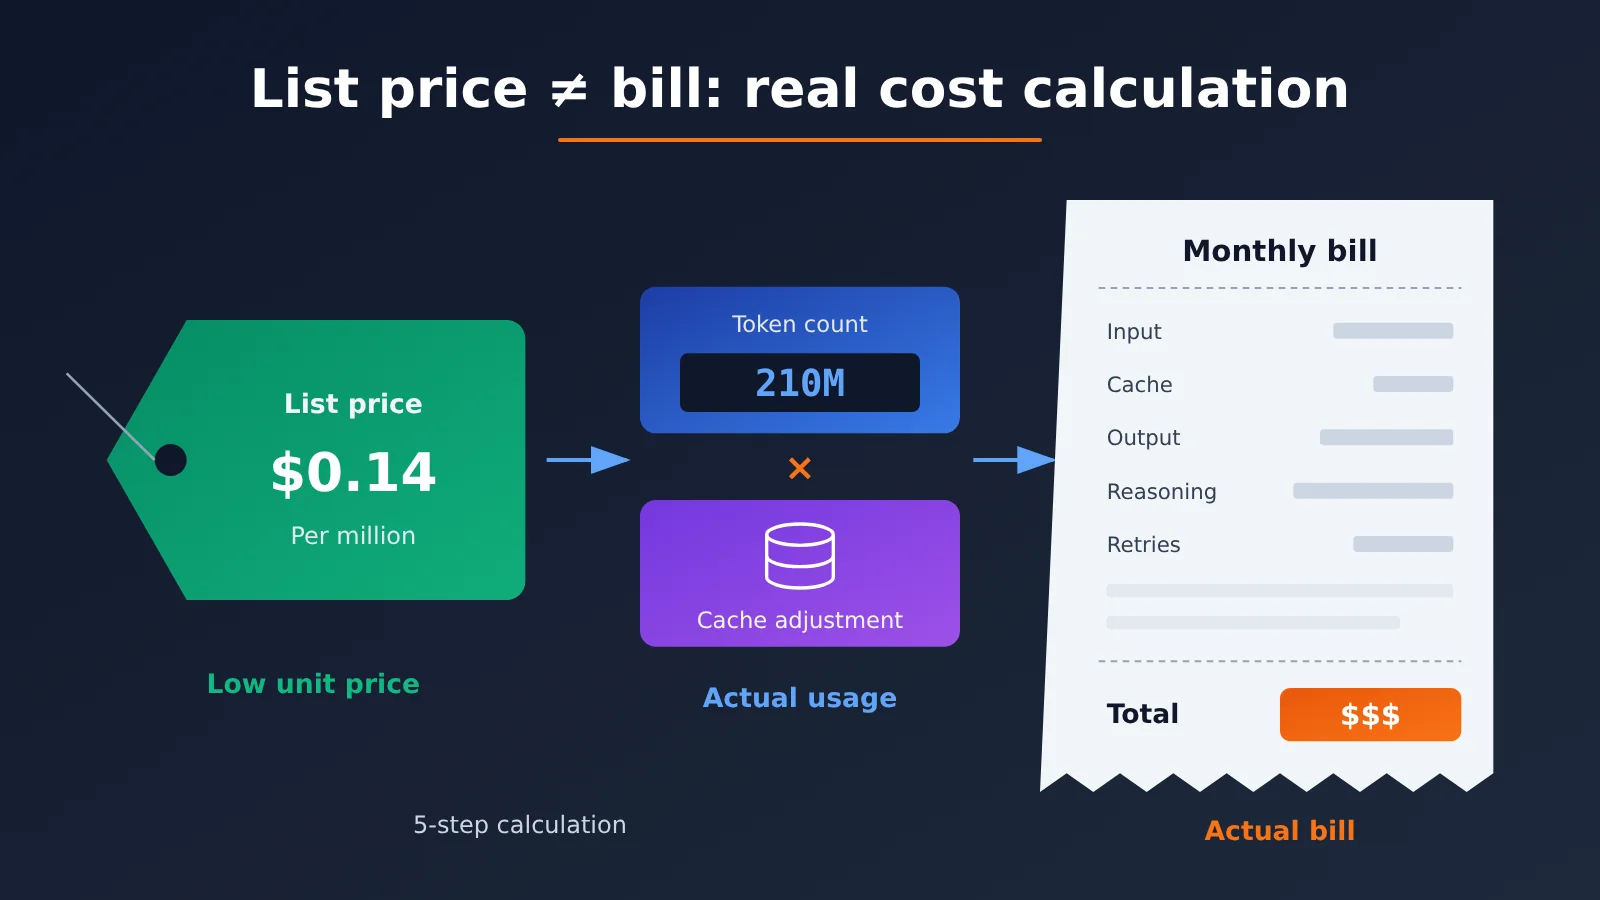
A third-party blog’s August 1, 2026 analysis offers a typical example: DeepSeek V4 Flash and Gemini 3.6 Flash both scored 50 on Artificial Analysis. The former was priced at $0.14/M and the latter at $1.50/M—a roughly 10-fold difference. But in the same benchmark, the former consumed about 210 million tokens, while the latter used about 59 million, a difference of more than threefold. The higher token consumption offset much of the unit-price advantage, so the actual cost gap was nowhere near 10-fold.
Tokenization differences are another factor. In an August 12, 2026 article, the same source had nine models count the tokens in an identical document. The results ranged from 614 to 957 tokens, with a difference of about 56% between the highest and lowest counts. In other words, even if two models have exactly the same input unit price, the input cost for the same prompt can differ by more than half.
💡 A note on the data: These figures come from one-off analyses by a third-party blog. Benchmark tasks, model versions, and prices change over time, so the figures only demonstrate that these differences exist. They can’t be used directly for your budget. You’ll need to test your own tasks.
Model billing breakdown: Which token types make up the real cost?
To calculate costs accurately, you first need to know what’s on the bill. Most providers’ charges fall into the categories below, though the exact names and whether they’re billed separately depend on each provider’s documentation.
| Billing item | What it means | Typical pricing | Easy to overlook |
|---|---|---|---|
| Uncached input | Newly sent prompt content that doesn’t hit the cache | Input price | Tokenization varies, so the same text can cost different amounts |
| Cached input | The prefix shared with a previous request | Cache read price, usually much lower than the input price | The prefix must match exactly for a cache hit |
| Cache write | Some providers charge separately for the initial cache write | May cost more than regular input | Can be more expensive when the hit rate is low |
| Visible output | The answer the user sees | Output price | Output is often several times more expensive than input |
| Reasoning tokens | The model’s internal reasoning process | Generally billed at the output price | They don’t appear in the answer, but they’re still billed |
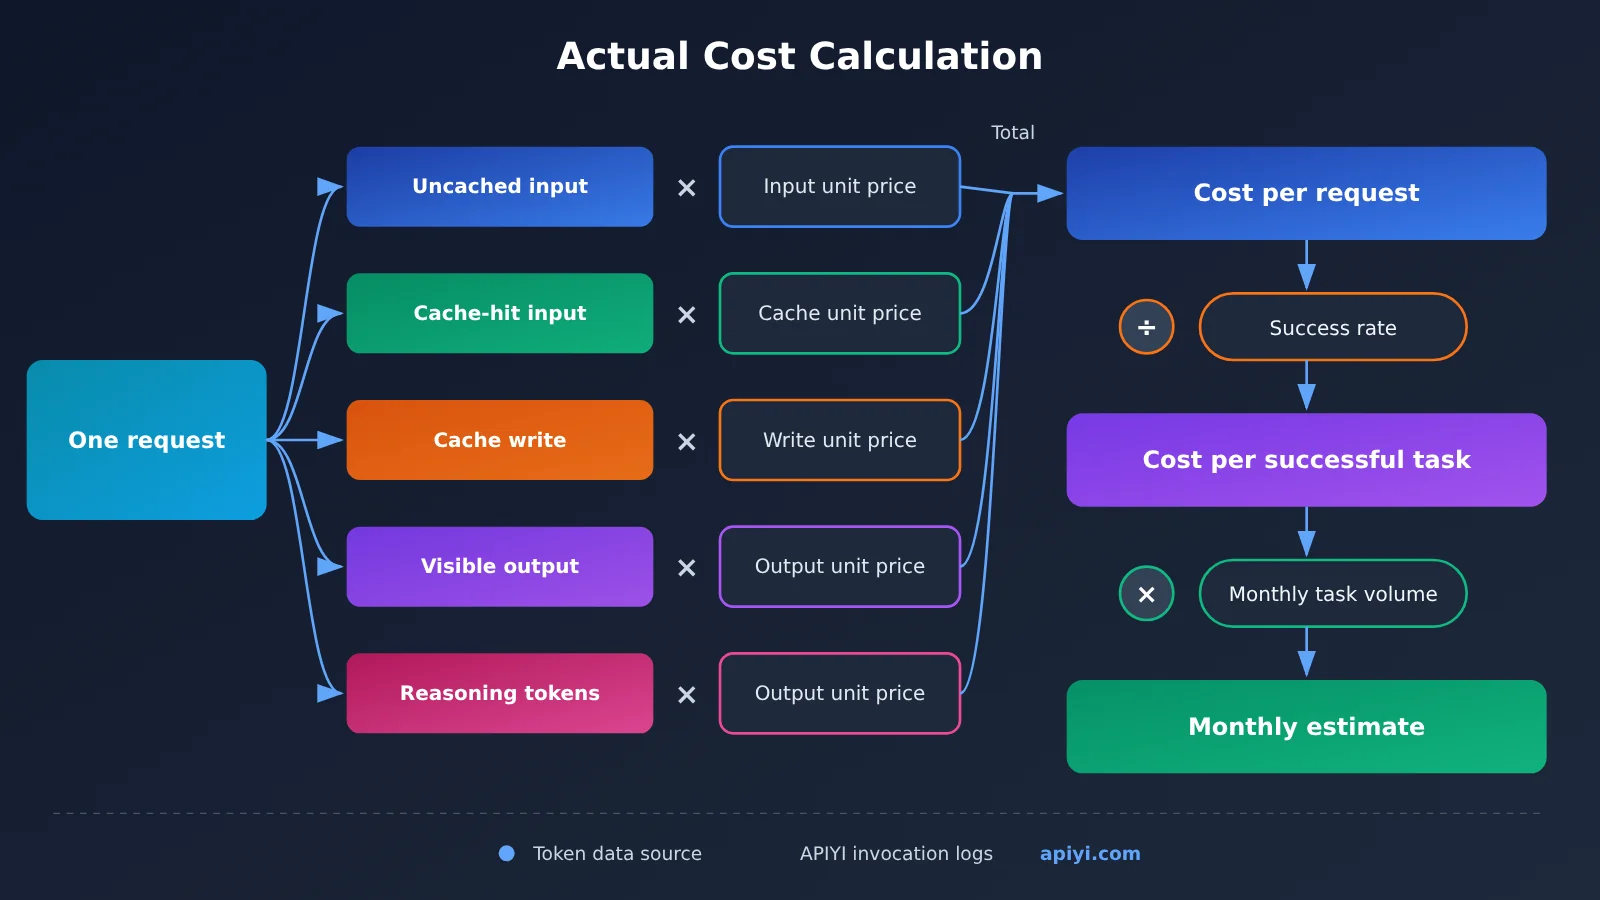
Put these together, and you get the core cost framework for this article:
- Cost per request = uncached input tokens × input price + cached input tokens × cache price + cache write tokens × write price + (visible output + reasoning tokens) × output price
- Effective cost per task = cost per request × average number of invocations ÷ task success rate
- Monthly estimate = effective cost per task × monthly task volume
The impact of caching is often underestimated. An August 6, 2026 article from the same source notes that DeepSeek V4 Flash’s cache-hit price is about 50 times cheaper than its cache-miss price, while cache prices across hosting providers can differ by as much as 28 times. In other words, the same model can produce very different bills depending on how you access it. Check cache prices for the channel you actually use.
How Reasoning Tokens Inflate Actual Costs
Reasoning models are the most common source of the “cheap list price, expensive bill” problem. A user might ask a single question and receive a 200-word answer, but the model may first use thousands of tokens internally to reason through it. Those tokens are usually billed at the output rate, which is already several times higher than the input rate.
Public estimates from third parties reflect this too. An article published on August 4, 2026, reported that Qwen 3.8 Max scored 3 points higher than DeepSeek V4 Flash on Artificial Analysis, but cost about 345 times more and ran about 6 times slower across three tasks in its own tests. Another article in the same series used the same evaluation method and reported that Kimi K3 scored 57 at a cost of $2,437, DeepSeek V4 Flash scored 50 at a cost of $72, and Qwen 3.7 Max scored 46 at a cost of $1,604. Lower scores can indeed come with higher costs, often because of the number of tokens consumed.
Differences can also appear between versions from the same vendor. One article noted that Claude Opus 4.5 through 4.8 and Opus 5 all have the same list price of $5/$25, but testing found a roughly 1.30-fold difference in token consumption. The price may stay the same while the bill changes by 30%—an easy detail to overlook when upgrading model versions.
Estimate Real Costs from Token Consumption: Get Started in 5 Steps
Here’s a small-sample estimation process you can run without writing complex scripts. The core principle is simple: for the same task and input, track input, output, cache, and reasoning tokens separately.
Step 1: Prepare a Representative Task Sample
Pick 20 to 50 requests from your production environment or real-world requirements, covering the main use cases, such as short Q&A, long documents, and multi-turn conversations. Keep the full system prompt and context in each sample, since cache hits primarily occur on these repeated prefixes. Don’t test with just a single “Hello”—that won’t reveal differences in tokenization or the effects of caching.
Step 2: Hold variables constant and call each candidate model
Use the same system prompt, user input, max_tokens, and temperature settings for each candidate model. If a reasoning model supports a reasoning effort parameter, record the level you use: different levels can result in significantly different reasoning token counts.
A unified entry point can save you a lot of work here. With an aggregation platform like APIYI apiyi.com, you can switch between models from different providers using the same API key and OpenAI-compatible calling method. Just change the model name to run the full comparison—there’s no need to create separate accounts, add funds, or adapt SDKs for each provider.
Step 3: Record each type of token
After each call, read the token counts from the response’s usage field. In the OpenAI-compatible format, common fields include:
usage.prompt_tokens: Total input tokensusage.prompt_tokens_details.cached_tokens: The portion served from cacheusage.completion_tokens: Total output tokensusage.completion_tokens_details.reasoning_tokens: The portion used for reasoning
Field names vary by provider. For example, the Anthropic format uses cache_read_input_tokens and cache_creation_input_tokens to distinguish cache reads from writes. Check each provider’s documentation for details.
If you don’t want to parse responses yourself, you can check the platform’s records instead. APIYI provides logs and usage statistics for each call, making it easy to compare consumption across models for the same batch of samples. Before estimating costs, check the console and platform billing documentation to confirm whether cached and reasoning tokens are listed separately and whether cache hits are billed separately.
🚀 Quick start: Try a small comparison with 20 samples on APIYI apiyi.com first. Once you have a sense of each model’s token usage, decide whether to expand the sample set. With a shared account balance, all your multi-model testing costs are in one place, making it easier to reconcile charges afterward.
Step 4: Summarize the results using the calculation template
Fill in the template below with one row per model. Be sure to include the date and source for each price.
| Field | What to enter | Data source |
|---|---|---|
| Model and version | Specify the version number or date suffix | Invocation parameters |
| Prices and date checked | Separate columns for input, output, cache reads, and cache writes | Official pricing page or the pricing page of the platform you’re using |
| Average uncached input tokens | Sample mean | Response usage or platform logs |
| Average cache-hit tokens | Sample mean, plus the cache hit rate | Response usage or platform logs (such as APIYI usage statistics) |
| Average visible output tokens | Total output minus reasoning tokens | Response usage |
| Average reasoning tokens | Record separately for reasoning models | Response usage |
| Task success rate | Percentage that passes manual or rule-based evaluation | Review records |
| Effective cost per task | Calculate using the formula above | Summary calculation |
Step 5: Make decisions based on effective cost per task
In the end, the comparison isn’t about the listed price—it’s about the “effective cost per task.” The following illustrative prices show how the calculation works. The figures are made up to explain the method and don’t represent actual prices for any model.
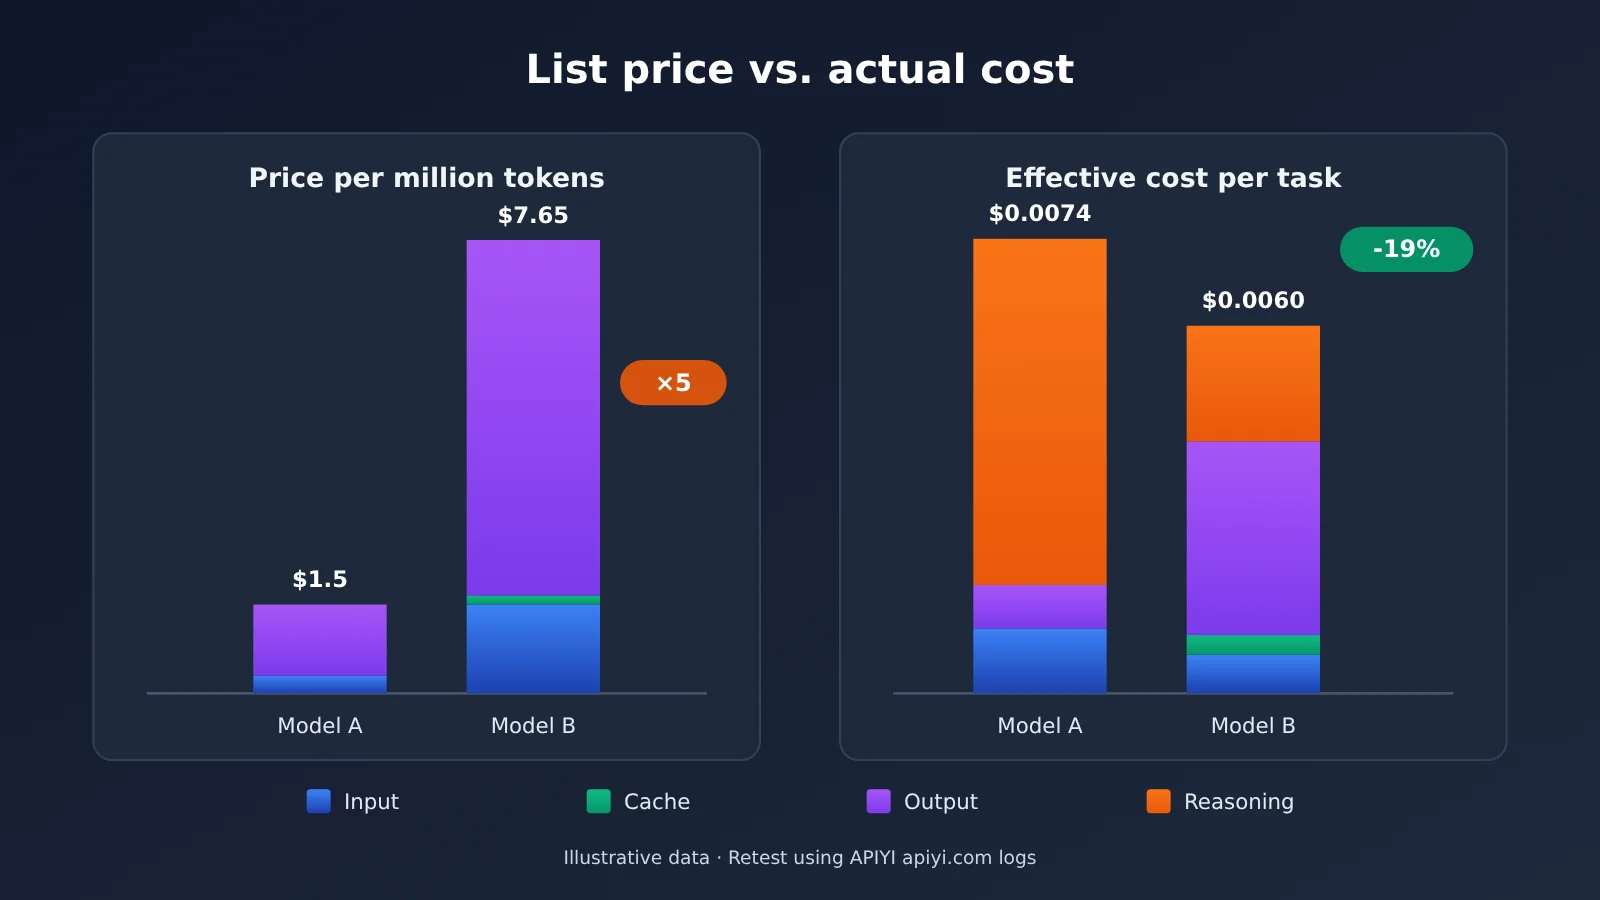
Suppose model A is priced at $0.3/M for input and $1.2/M for output. Model B is priced at $1.5/M for input, $6/M for output, and $0.15/M for cache reads. Its input and output prices are five times those of A.
| Calculation | Model A (lower price) | Model B (higher price) |
|---|---|---|
| Uncached input tokens | 3,000 | 400 |
| Cache-hit tokens | 0 | 2,000 |
| Visible output + reasoning tokens | 500 + 4,000 | 500 + 300 |
| Input cost | $0.0009 | $0.0006 + $0.0003 |
| Output cost | $0.0054 | $0.0048 |
| Cost per request | $0.0063 | $0.0057 |
| Task success rate | 85% | 95% |
| Effective cost per task | About $0.0074 | About $0.0060 |
In this example, model B uses more compact tokenization, reducing the total input by 600 tokens. Most of its long system prompt is served from the cache, and its reasoning process is much shorter. As a result, B’s listed price is five times higher, but its effective cost is about 19% lower than A’s. In practice, the result could be the opposite—which is why you need to retest using your own tasks.
What to Watch for When Calculating Real Costs
The calculation framework itself isn’t complicated, but a few pitfalls can skew the results. Check each one before you start:
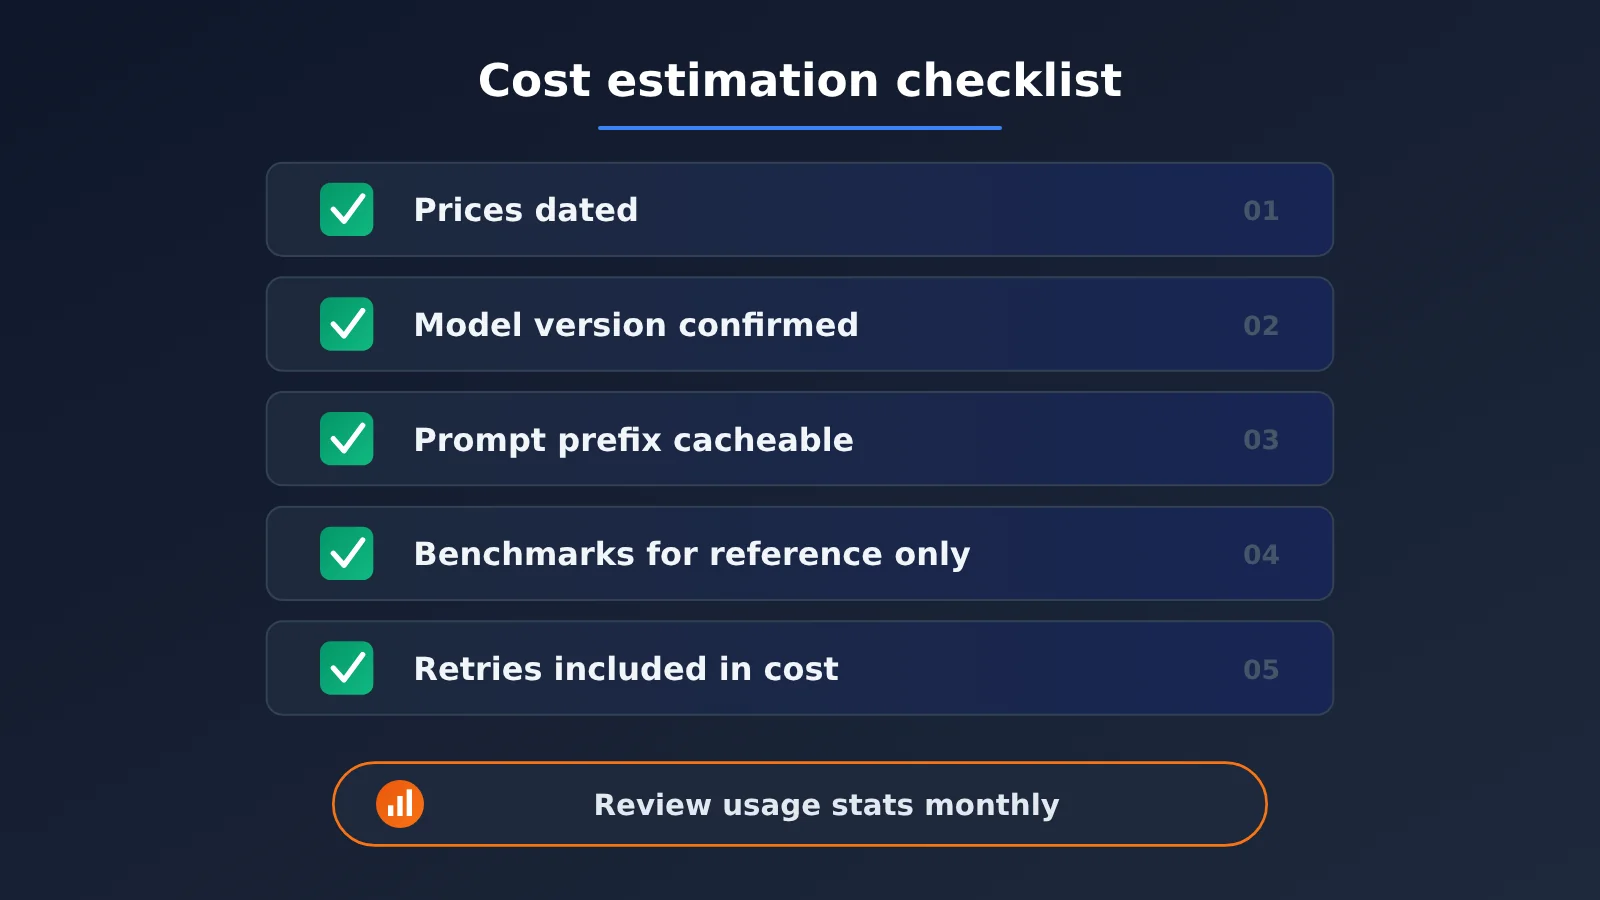
- Always date your prices: Model prices change frequently. One reference notes that DeepSeek V4 Pro 0813 uses peak and off-peak pricing starting August 16, 2026. Prices for the same model can also vary by time of day and provider.
- Check which version a model alias points to: One article noted that a seemingly “most commonly used” model name actually invoked an older version. Record the model identifier returned in the response so you don’t test version A and deploy version B.
- Cache hits depend on matching prefixes: Putting dynamic content, such as timestamps or user IDs, at the start of a prompt makes the prefix different every time, so you’ll get almost no cache hits. Use the same prompt structure in your tests as you do in production.
- Treat third-party benchmarks as a reference: Aggregate scores from sources like Artificial Analysis, along with their per-task cost calculations, reflect the evaluator’s mix of tasks—not necessarily your business use case.
- Include retries: Reruns caused by 429 rate limits, formatting errors, or unacceptable answers all add to the cost. Calculate the success rate based on your actual acceptance criteria.
💰 Cost optimization tip: Once you’ve finished testing, consider using “effective cost per successful task” as your main selection metric, with benchmark scores and latency as constraints. On APIYI apiyi.com, switching models only requires changing the model name, making it easy to update your production configuration as your findings change. You can also keep monitoring actual consumption through invocation logs.
Frequently Asked Questions
Q1: What is a model’s “real cost”?
Real cost is what you actually pay to complete a specific task, not the listed price per million tokens. To calculate it, multiply the actual number of each token type—uncached input, cache hits, cache writes, visible output, and reasoning—by its corresponding rate. Then account for success rates and retries to get the effective cost per task.
Q2: Why does the same document have different token counts across models?
Each model uses a different tokenizer, which splits Chinese text, code, and punctuation differently. In one published calculation, the same document was counted as anywhere from 614 to 957 tokens across nine models. That’s why input costs must be calculated using each model’s own reported token count—you can’t apply one model’s count to another.
Q3: Do reasoning tokens always need to be included in the cost?
Yes. Most providers count reasoning tokens as output and charge for them at the output rate. They don’t appear in the answer itself, but they can make up most of the output. When evaluating reasoning models, record `reasoning_tokens` separately and compare models at the same reasoning-effort level.
Q4: How much can cache hits save?
It depends on the provider’s cache pricing and your hit rate. The reference material notes that DeepSeek V4 Flash cache hits cost about 1/50 of uncached input, but cache prices can vary by as much as 28 times across hosting providers. Long system prompts, fixed knowledge-base prefixes, and multi-turn conversations benefit the most. Check your provider’s pricing for the actual rates.
Q5: How can I quickly estimate costs for multiple models using a small sample?
We recommend using a platform that provides unified access to multiple models:
1. Sign up at APIYI apiyi.com and get an API key
2. Prepare 20 to 50 real task samples, keeping prompts and parameters consistent
3. Invoke each model by changing the model name, then use invocation logs and usage statistics to total each token type
4. Calculate the effective cost per task using the template in this article
This lets you complete the comparison with one account and one invocation method, reducing the overhead of opening accounts with multiple providers and reconciling charges.
Q6: Can I use “cost per task” figures from third-party blogs directly?
We don’t recommend using them directly for budgeting. These figures are useful for identifying models that may differ in token consumption and narrowing down your shortlist. But evaluation tasks, model versions, prices, and cache conditions may all differ from yours, so you’ll need to verify the final numbers with your own samples.
Q7: What are the limitations of this cost-estimation method?
A small sample only reflects the types of tasks it covers, so you’ll need to retest if your workload distribution changes. Also, some platforms’ logs may not distinguish cache tokens from reasoning tokens. In that case, you’ll need to collect them yourself from the `usage` field in the model response. Prices and model versions can change too, so it’s a good idea to run another round after each price change or upgrade.
Key Takeaways for Calculating Actual Model Costs
- Unit pricing is only half the equation: Your bill depends on the unit price multiplied by actual token usage.
- Tokenization differences matter: The same document can produce over 50% more tokens in one model than another.
- Reasoning tokens can inflate output costs: The unseen reasoning process is also billed as output.
- Cache pricing varies by provider: Both the cache hit rate and cache unit price determine costs for long prompts.
- Decide based on effective cost per task: Factor in success rates and retries.
- Use a unified interface for comparison testing: APIYI’s unified interface and invocation logs make it easier to run the same samples across multiple models.
Summary
Estimating a model’s actual cost from token usage and caching comes down to three things:
- Break down the bill: Track uncached input, cache hits, cache writes, visible output, and reasoning tokens separately, then multiply each by its corresponding unit price.
- Test with your own tasks: Third-party benchmarks and prices are useful references, but measurements from the same task and input are more reliable.
- Compare effective cost per task: Factor in success rates and retries, then use your monthly task volume to build a budget.
Model prices will change, and new models will keep appearing, but you can reuse this approach over time. Before choosing your next model, run a comparison using 20 real samples, then decide which one to put into production. If you need to switch quickly between models from different providers, APIYI at apiyi.com offers a unified interface and invocation logs to help you check each model’s actual usage.
📚 References
- Ofox.ai Blog, Page 23: Includes article summaries comparing token consumption for DeepSeek V4 Flash and Gemini 3.6 Flash, differences in cache pricing, and cost estimates for the Qwen series.
- Link:
ofox.ai/blog/page/23/ -
Note: The articles were published in August 2026. The figures are based on a third party’s one-time measurements and should be used only as a general reference.
-
Ofox.ai Blog, Page 22: Covers token counts for the same document across nine models, differences in token consumption between Claude versions, and time-of-day pricing for DeepSeek V4 Pro.
- Link:
ofox.ai/blog/page/22/ -
Note: Useful for concrete examples of differences in tokenization and model versions.
-
Ofox.ai Blog, Page 25: Includes single-task cost comparisons for Kimi K3, GLM-5.2, and Opus 4.8.
- Link:
ofox.ai/blog/page/25/ - Note: Prices and benchmark scores change over time. Check each provider’s official pricing page before using the figures.
Author: APIYI Technical Team
Technical discussions: Contact us through the APIYI homepage at apiyi.com. For more integration resources, visit the documentation center at docs.apiyi.com.