Author's Note: A detailed guide on how to use Nano Banana 2 to generate research illustrations that meet the requirements of top-tier journals like Nature, Science, and Cell. Includes 7 prompt techniques, 5 types of chart templates, and complete API invocation code.
In a research paper, a high-quality figure often determines the reviewer's first impression. Traditional scientific illustration relies on tools like BioRender and Adobe Illustrator, which have steep learning curves and can be expensive.
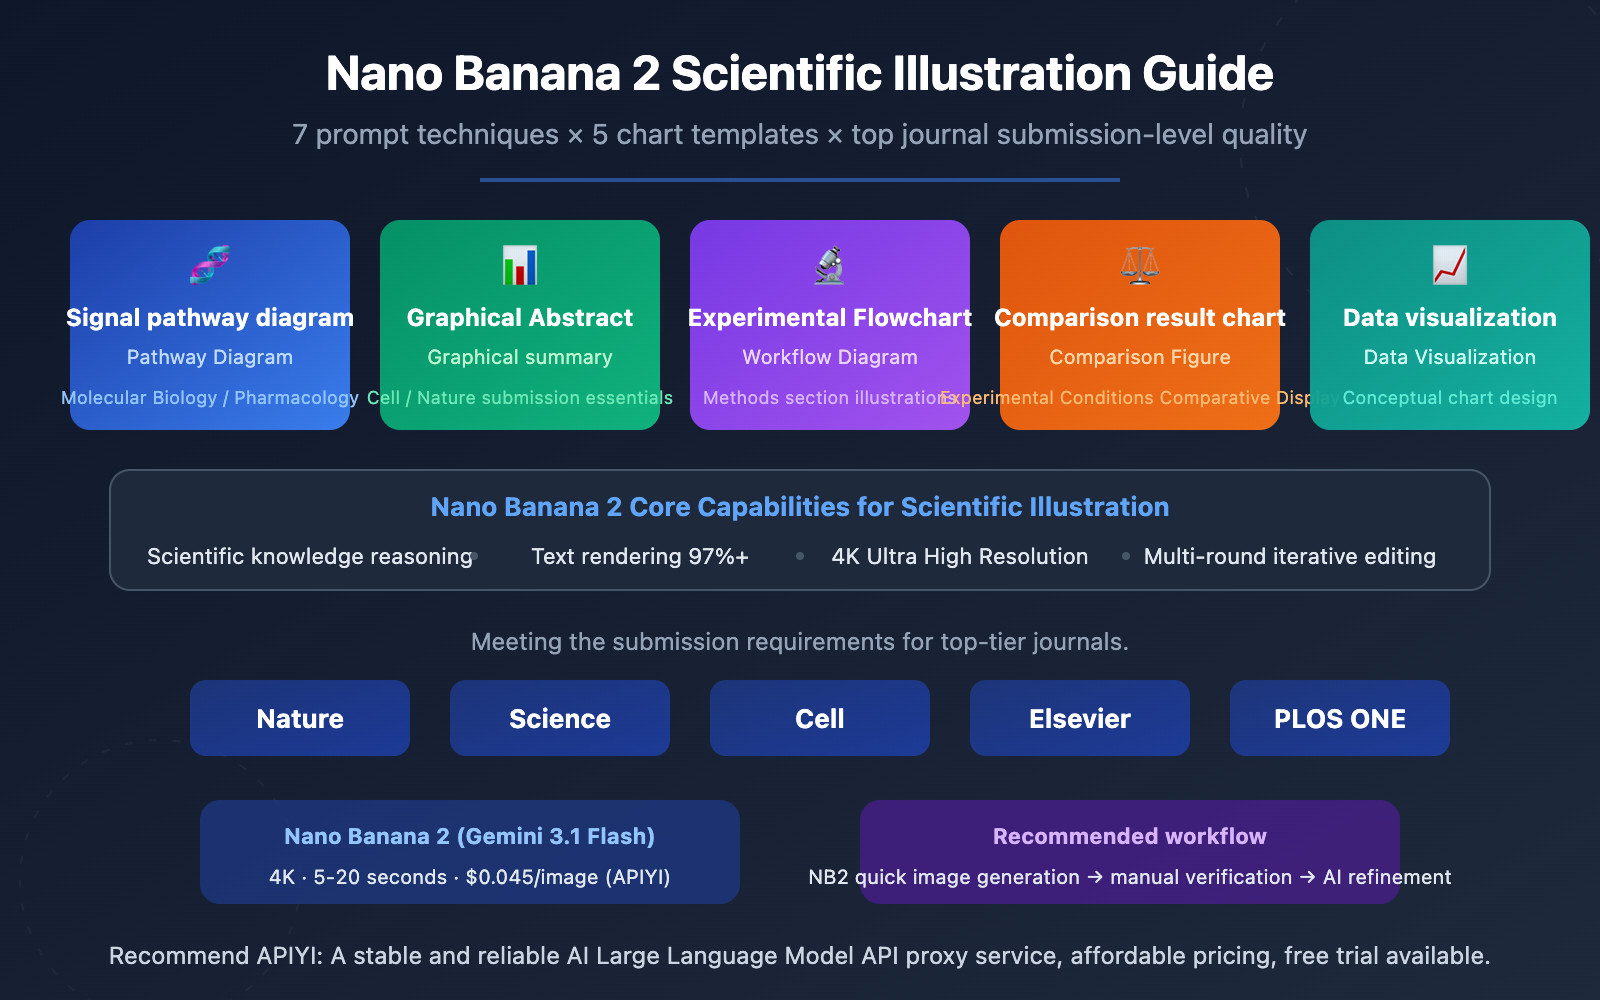
Now, Nano Banana 2, with its built-in scientific knowledge reasoning and precise text rendering capabilities, is becoming a new choice for researchers. From signaling pathway diagrams to graphical abstracts, from experimental flowcharts to data visualizations, a single prompt can generate research illustrations approaching publication quality.
Core Value: By reading this article, you'll master 7 scientific illustration prompt techniques, get 5 prompt templates for top-journal chart types, and learn the complete workflow for batch generation and iterative optimization of research illustrations via API.
Nano Banana 2 Scientific Illustration Key Points
| Key Point | Description | Value |
|---|---|---|
| Built-in Scientific Knowledge | Based on the Gemini 3 architecture, understands concepts in biology, chemistry, physics, and other disciplines | No need to manually label every component |
| 97%+ Text Rendering Accuracy | Near-perfect English labeling, supports multilingual text rendering | Accurate presentation of gene names, protein names, chemical formulas |
| 4K Ultra-High Resolution | Natively supports 4096px output, meeting 300 DPI requirements | Directly meets the resolution standards for top-tier journal submissions |
| Multi-turn Dialogue Editing | Supports iterative modifications and gradual detail adjustments | Fits the fine-tuning workflow of scientific illustration |
| Extremely Low Cost | $0.045 per image, less than $0.5 for 10 iterations | Significant savings compared to BioRender's $15/month subscription |
The Core Advantage of Nano Banana 2 for Scientific Illustration
The biggest difference between Nano Banana 2 (Gemini 3.1 Flash Image Preview) and traditional drawing tools is that it's not just a "drawing tool" but a scientific concept-aware illustration engine. When you input "MAPK/ERK signaling pathway with RAS activation," it can correctly understand the RAS→RAF→MEK→ERK cascade relationship based on Gemini's knowledge base and automatically generate a reasonable pathway diagram layout, rather than simply drawing a few boxes and arrows.
This "knowledge-driven" generation method is crucial for scientific illustration—it means you can focus more on designing the scientific narrative rather than worrying about the position and connections of each component.
The Applicable Boundaries of Nano Banana 2 for Scientific Illustration
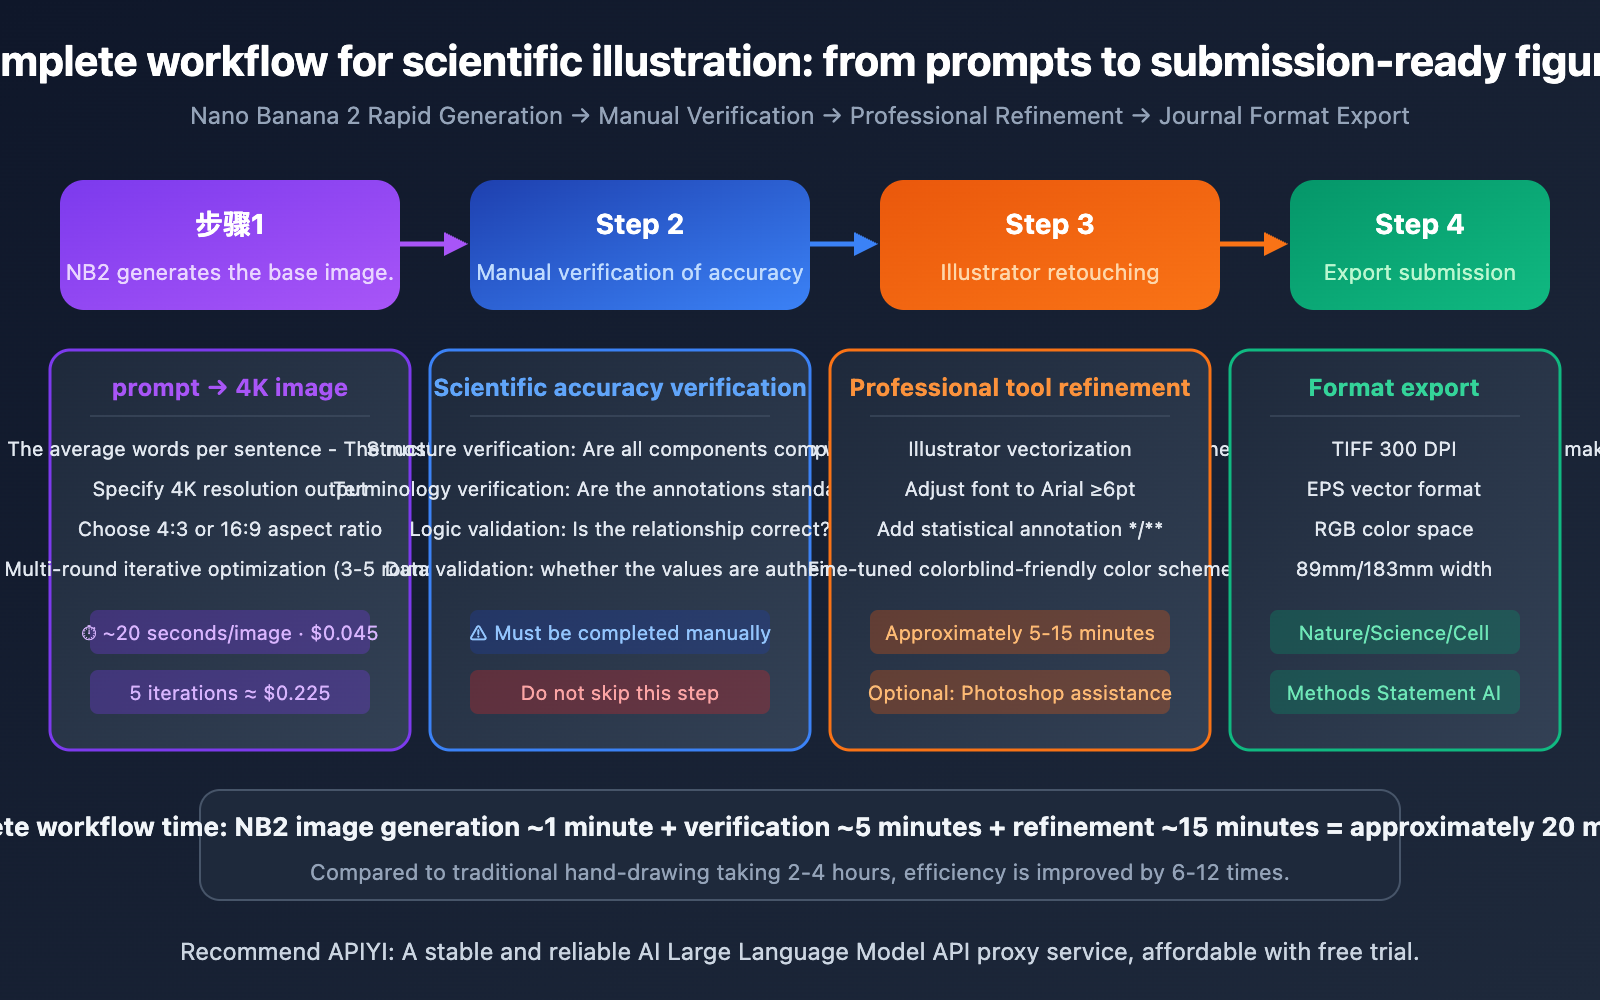
It's important to clarify that AI-generated scientific illustrations are currently better suited as rapid prototypes and base versions. Final submission-level figures usually require fine-tuning in professional tools like Illustrator or Photoshop. The recommended workflow is: Nano Banana 2 for quick generation → manual verification of scientific accuracy → refinement and export in a professional tool.
7 Prompt Techniques for Scientific Illustration with Nano Banana 2
These 7 techniques form the core methodology for scientific illustration prompts and are applicable to all types of research figures.
Technique 1: Use Precise Discipline-Specific Terminology
Prompts for scientific illustrations must use standardized, discipline-specific terminology, not colloquial descriptions. Nano Banana 2, leveraging Gemini's knowledge base, correctly understands professional jargon and generates academically compliant charts.
| Colloquial Description (Poor Result) | Discipline-Specific Terminology (Good Result) | Applicable Field |
|---|---|---|
| Cell signaling process | MAPK/ERK signaling cascade with phosphorylation events | Molecular Biology |
| Diagram of DNA replication | Semi-conservative DNA replication fork with leading and lagging strand | Genetics |
| Drug mechanism of action | Pharmacokinetic ADME pathway diagram | Pharmacology |
| Protein structure | Protein tertiary structure with alpha-helix and beta-sheet domains | Structural Biology |
| Chemical reaction process | SN2 nucleophilic substitution reaction mechanism with transition state | Organic Chemistry |
Prompt Example:
Create a scientific schematic of the PI3K/AKT/mTOR signaling pathway.
Include: receptor tyrosine kinase activation, PI3K recruitment,
PIP2 to PIP3 conversion, AKT phosphorylation at Thr308 and Ser473,
mTORC1 and mTORC2 complexes, downstream targets S6K1 and 4E-BP1.
Use standard molecular biology iconography.
Arrows indicate activation, flat-headed lines indicate inhibition.
Clean white background, publication-quality, 4K resolution.
Technique 2: Specify Publication-Level Format Parameters
Different top-tier journals have strict formatting requirements for figures. Specifying these parameters directly in the prompt reduces post-generation adjustment work.
| Journal | Single Column Width | Double Column Width | Minimum DPI | Recommended Format | Font Requirements |
|---|---|---|---|---|---|
| Nature | 89mm | 183mm | 300 DPI | TIFF/EPS | Arial/Helvetica ≥6pt |
| Science | 85mm | 174mm | 300 DPI | EPS/PDF | Helvetica ≥6pt |
| Cell | 85mm | 174mm | 300 DPI | TIFF/PDF | Arial ≥6pt |
| Elsevier | 90mm | 190mm | 300-1000 DPI | TIFF/EPS | Arial ≥8pt |
| PLOS ONE | 83mm | 173mm | 300 DPI | TIFF/PNG | Arial/Helvetica ≥8pt |
Format Parameter Suffix (Append to any scientific illustration prompt):
Output specifications: 4K resolution (4096px width),
white or light gray background,
Arial font family, minimum 8pt text size,
RGB color mode, high contrast,
clean layout with adequate white space,
suitable for Nature/Science journal submission
Technique 3: Multi-turn Conversation for Iterative Refinement
Scientific illustrations are rarely perfect on the first try. Nano Banana 2 supports multi-turn conversational editing, allowing you to make step-by-step adjustments based on previous results.
Iterative Refinement Strategy:
- Round 1: Generate the basic structure and layout
- Round 2: Adjust the size and position of annotation text
- Round 3: Optimize the color scheme for colorblind accessibility
- Round 4: Refine details and align element spacing
Modify only one aspect per round to avoid confusing the model with too many changes at once. For example:
Round 1: "Create a schematic of CRISPR-Cas9 gene editing mechanism..."
Round 2: "Make the guide RNA label larger, move it to the upper right"
Round 3: "Change the Cas9 protein color from blue to teal (#0d9488)"
Round 4: "Add a scale bar and increase spacing between PAM site label and the DNA"
Technique 4: Specify Academic Color Conventions
Color schemes for scientific figures need to follow academic conventions while ensuring colorblind-friendliness (approximately 8% of males have red-green color vision deficiency).
Recommended Academic Color Scheme:
Color scheme for scientific figure:
- Activation/positive: green (#10b981 to #34d399)
- Inhibition/negative: red (#ef4444 to #f87171)
- Neutral pathways: blue (#3b82f6 to #60a5fa)
- Highlighted element: orange (#f97316 to #fb923c)
- Background structures: gray (#94a3b8 to #cbd5e1)
Ensure colorblind accessibility (deuteranopia-safe).
Use hatching patterns as secondary visual encoding.
Colorblind-Friendly Principle: Avoid relying solely on red-green to distinguish information. Use blue-orange contrast as an alternative to red-green, and overlay shapes or textures as auxiliary encoding.
Technique 5: Generate Complex Figures in Modules
Figures in top-tier papers often contain multiple panels (A, B, C, D). Generating a complex multi-panel figure all at once can lead to layout confusion. It's recommended to generate them in modules and then combine them in Illustrator.
Multi-panel Figure Prompt Template:
Generate Panel [A/B/C/D] of a multi-panel scientific figure:
Panel content: [Specific content description]
Panel size: 85mm x 85mm (square format)
Panel label: Bold letter "[A]" in top-left corner, 12pt Arial
Consistent color scheme: [Color scheme description]
White background, 4K resolution, clean borders
Leave 5mm margin on all sides for assembly
Technique 6: Use Reference Images to Improve Accuracy
Nano Banana 2 supports uploading up to 14 reference images. For scientific illustration, uploading published figures from similar topics in your target journal as style references can significantly improve the academic style consistency of the output.
How to Use Reference Images:
- Upload 1-2 published figures on similar topics from your target journal
- In the prompt, state:
Follow the visual style and layout of the reference figure - Clearly specify which elements to retain and which content to change
Technique 7: Reserve Space for Statistical Annotations and Legends
Scientific figures often require statistical annotations (e.g., significance asterisks *, **, ***) and legends. Currently, AI's accuracy in generating these fine annotations is limited, so it's recommended to reserve space for them in the prompt.
Leave space in the upper-right corner for a legend box (approximately 25mm x 15mm).
Leave space above each bar for statistical significance markers.
Do not generate placeholder statistics - I will add real p-values manually.
🎯 Practical Advice: It's recommended to add statistical annotations manually in Illustrator during the final stage to ensure numerical accuracy. Use the APIYI platform at apiyi.com to call Nano Banana 2 for rapid generation of the base figure, then complete the final polish in professional tools.
5 Chart Templates for Scientific Illustration with Nano Banana 2
The following 5 templates cover the most common figure types in research papers. You can use them by copying the prompts directly.
Template 1: Signaling Pathway Mechanism Diagram (Pathway Diagram)
Suitable for fields like molecular biology, cell biology, and pharmacology.
Create a publication-quality schematic diagram of [PATHWAY NAME].

Components to include:
- [Receptor/protein 1] at the cell membrane
- [Kinase cascade: A → B → C → D]
- [Transcription factor] translocation to nucleus
- [Target gene] activation

Visual specifications:
- Cell membrane as a phospholipid bilayer at the top
- Cytoplasm in light beige, nucleus in light blue
- Activation arrows: solid green (#10b981), 2pt weight
- Inhibition lines: flat-headed red (#ef4444), 2pt weight
- Protein nodes: rounded rectangles with gradient fill
- All labels in Arial 10pt, black text on white background boxes
- White background, 4K resolution
- Style: Nature Reviews Molecular Cell Biology
Template 2: Graphical Abstract
Top-tier journals increasingly require submission of a Graphical Abstract—a single image summarizing the core findings of a study.
Create a Graphical Abstract for a research paper about [RESEARCH TOPIC].

Layout: left-to-right narrative flow, 3 main sections
- Left section: [Input/Problem/Starting material]
- Center section: [Method/Process/Intervention]
- Right section: [Output/Result/Discovery]

Connect sections with bold directional arrows.
Use icons and simplified illustrations rather than text.
Minimal text labels, maximum 15 words total.
Color palette: [primary color] for main elements, [accent color] for highlights.
Size: landscape orientation, 16:9 aspect ratio.
Clean white background, modern flat design style.
4K resolution, suitable for Cell/Nature submission.
Template 3: Experimental Workflow Diagram
Suitable for illustrating experimental procedures in the Methods section.
Create a step-by-step experimental workflow diagram for [EXPERIMENT NAME].

Steps (left to right or top to bottom):
1. [Step 1: Sample preparation - brief description]
2. [Step 2: Treatment/Processing - brief description]
3. [Step 3: Analysis method - brief description]
4. [Step 4: Data collection - brief description]
5. [Step 5: Results - brief description]

Visual style:
- Each step as a rounded rectangle with icon
- Connected by arrows with brief condition labels (e.g., "37°C, 24h")
- Timeline or duration indicators between steps
- Color-coded by phase: preparation (blue), experiment (green), analysis (purple)
- Clean white background, Arial font, 4K resolution
- Publication-ready for supplementary materials
Template 4: Comparative Results Figure
Suitable for comparing different experimental conditions or methods.
Create a scientific comparison figure showing [COMPARISON TOPIC].

Layout: side-by-side comparison, 2-3 conditions
- Condition A: [Control group description]
- Condition B: [Treatment group description]
- Condition C (optional): [Alternative treatment]

Include:
- Representative images/schematics for each condition
- Consistent scale and orientation across conditions
- Condition labels at the top (bold, 12pt)
- Key differences highlighted with colored annotations
- Scale bar in bottom-right corner
- White background, 4K resolution, Nature-style layout
Template 5: Data Visualization Concept Diagram
Suitable for conceptual visualization of complex data relationships (Note: precise data plots should still be generated with Python/R).
Create a conceptual data visualization diagram showing [DATA RELATIONSHIP].

Visualization type: [heatmap concept / network diagram / Venn diagram / scatter plot concept]
Key elements:
- [X-axis/Category 1]: [description]
- [Y-axis/Category 2]: [description]
- [Data trend/Pattern]: [description]

Style:
- Clean minimalist design
- Color gradient: [low value color] to [high value color]
- Clear axis labels and title
- Legend in top-right corner
- White background, 4K resolution
Note: This is a conceptual illustration. Real data plots should be generated with matplotlib/R.
💡 Important Reminder: Nano Banana 2 excels at generating conceptual scientific illustrations (mechanism diagrams, flowcharts, Graphical Abstracts). However, precise statistical charts (bar charts, scatter plots with real data) are still best generated using Python matplotlib or R ggplot2. AI-generated data visualizations may contain inaccurate numerical values and require strict verification.
Nano Banana 2 Scientific Illustration API Quick Start
Minimal Example
The following code uses the APIYI platform to call Nano Banana 2 and generate a scientific signaling pathway diagram:
import requests, base64

API_KEY = "your-apiyi-api-key"
ENDPOINT = "https://api.apiyi.com/v1beta/models/gemini-3.1-flash-image-preview:generateContent"

prompt = """Create a publication-quality schematic of the Wnt/beta-catenin signaling pathway.
Include: Wnt ligand, Frizzled receptor, Dishevelled, GSK-3beta destruction complex,
beta-catenin stabilization and nuclear translocation, TCF/LEF transcription.
Activation arrows in green, inhibition in red. White background, Arial font, 4K resolution."""

payload = {
    "contents": [{"parts": [{"text": prompt}]}],
    "generationConfig": {"responseModalities": ["IMAGE"], "imageConfig": {"aspectRatio": "4:3", "imageSize": "4K"}}
}

response = requests.post(ENDPOINT, headers={"Content-Type": "application/json", "x-goog-api-key": API_KEY}, json=payload, timeout=120)
image_data = response.json()["candidates"][0]["content"]["parts"][0]["inlineData"]["data"]
with open("wnt_pathway.png", "wb") as f:
    f.write(base64.b64decode(image_data))
View Complete Code for Multi-Round Iterative Editing
import requests
import base64
import json

API_KEY = "your-apiyi-api-key"
ENDPOINT = "https://api.apiyi.com/v1beta/models/gemini-3.1-flash-image-preview:generateContent"

headers = {"Content-Type": "application/json", "x-goog-api-key": API_KEY}

def generate_figure(prompt, filename, aspect_ratio="4:3", size="4K"):
    """Generate a single scientific illustration"""
    payload = {
        "contents": [{"parts": [{"text": prompt}]}],
        "generationConfig": {
            "responseModalities": ["IMAGE"],
            "imageConfig": {"aspectRatio": aspect_ratio, "imageSize": size}
        }
    }
    response = requests.post(ENDPOINT, headers=headers, json=payload, timeout=120)
    result = response.json()
    image_data = result["candidates"][0]["content"]["parts"][0]["inlineData"]["data"]
    with open(filename, "wb") as f:
        f.write(base64.b64decode(image_data))
    print(f"Saved: {filename}")
    return result

# ========== Multi-Round Iteration Example ==========

# Round 1: Generate base version
prompt_r1 = """Create a schematic of CRISPR-Cas9 gene editing mechanism.
Show: guide RNA binding to target DNA, Cas9 protein cutting double-strand,
PAM site recognition, and DNA repair pathways (NHEJ and HDR).
White background, publication quality, 4K resolution."""

generate_figure(prompt_r1, "crispr_v1.png")

# Round 2: Adjust annotations (pass previous image as reference)
prompt_r2 = """Based on the previous CRISPR diagram, make these changes:
1. Enlarge the guide RNA label to 12pt bold
2. Add a dashed box around the PAM site region
3. Use blue (#3b82f6) for NHEJ pathway, green (#10b981) for HDR pathway
4. Add small arrow labels for 'Blunt-end joining' and 'Template-directed repair'
Keep all other elements unchanged. 4K resolution."""

# Read previous image as reference input
import pathlib
prev_image = pathlib.Path("crispr_v1.png").read_bytes()
payload_r2 = {
    "contents": [{
        "parts": [
            {"inlineData": {"mimeType": "image/png", "data": base64.b64encode(prev_image).decode()}},
            {"text": prompt_r2}
        ]
    }],
    "generationConfig": {
        "responseModalities": ["IMAGE"],
        "imageConfig": {"aspectRatio": "4:3", "imageSize": "4K"}
    }
}
response_r2 = requests.post(ENDPOINT, headers=headers, json=payload_r2, timeout=120)
result_r2 = response_r2.json()
image_r2 = result_r2["candidates"][0]["content"]["parts"][0]["inlineData"]["data"]
with open("crispr_v2.png", "wb") as f:
    f.write(base64.b64decode(image_r2))
print("Saved: crispr_v2.png (iteration 2)")
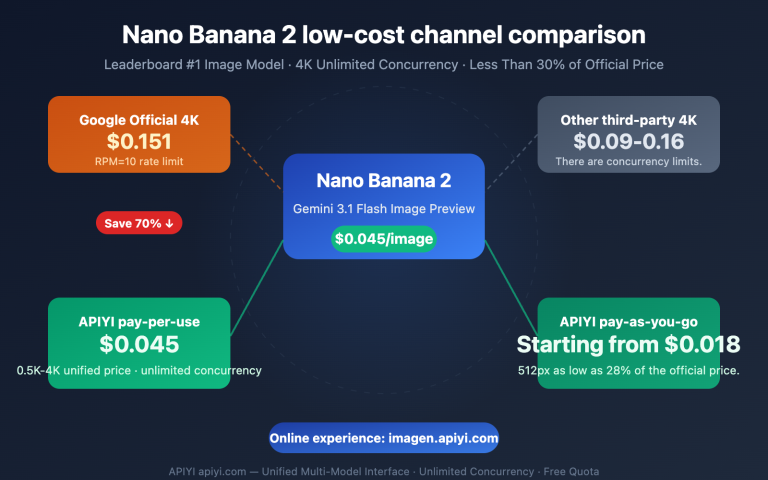
Recommendation: Scientific illustration typically requires 3-5 rounds of iteration to achieve satisfactory results. By calling Nano Banana 2 via APIYI apiyi.com, you pay per use at $0.045 per call. Five rounds of iteration cost only $0.225 (approx. ¥1.6), far less than the monthly fees of professional tools like BioRender.
Nano Banana 2 Scientific Illustration vs. Traditional Tools
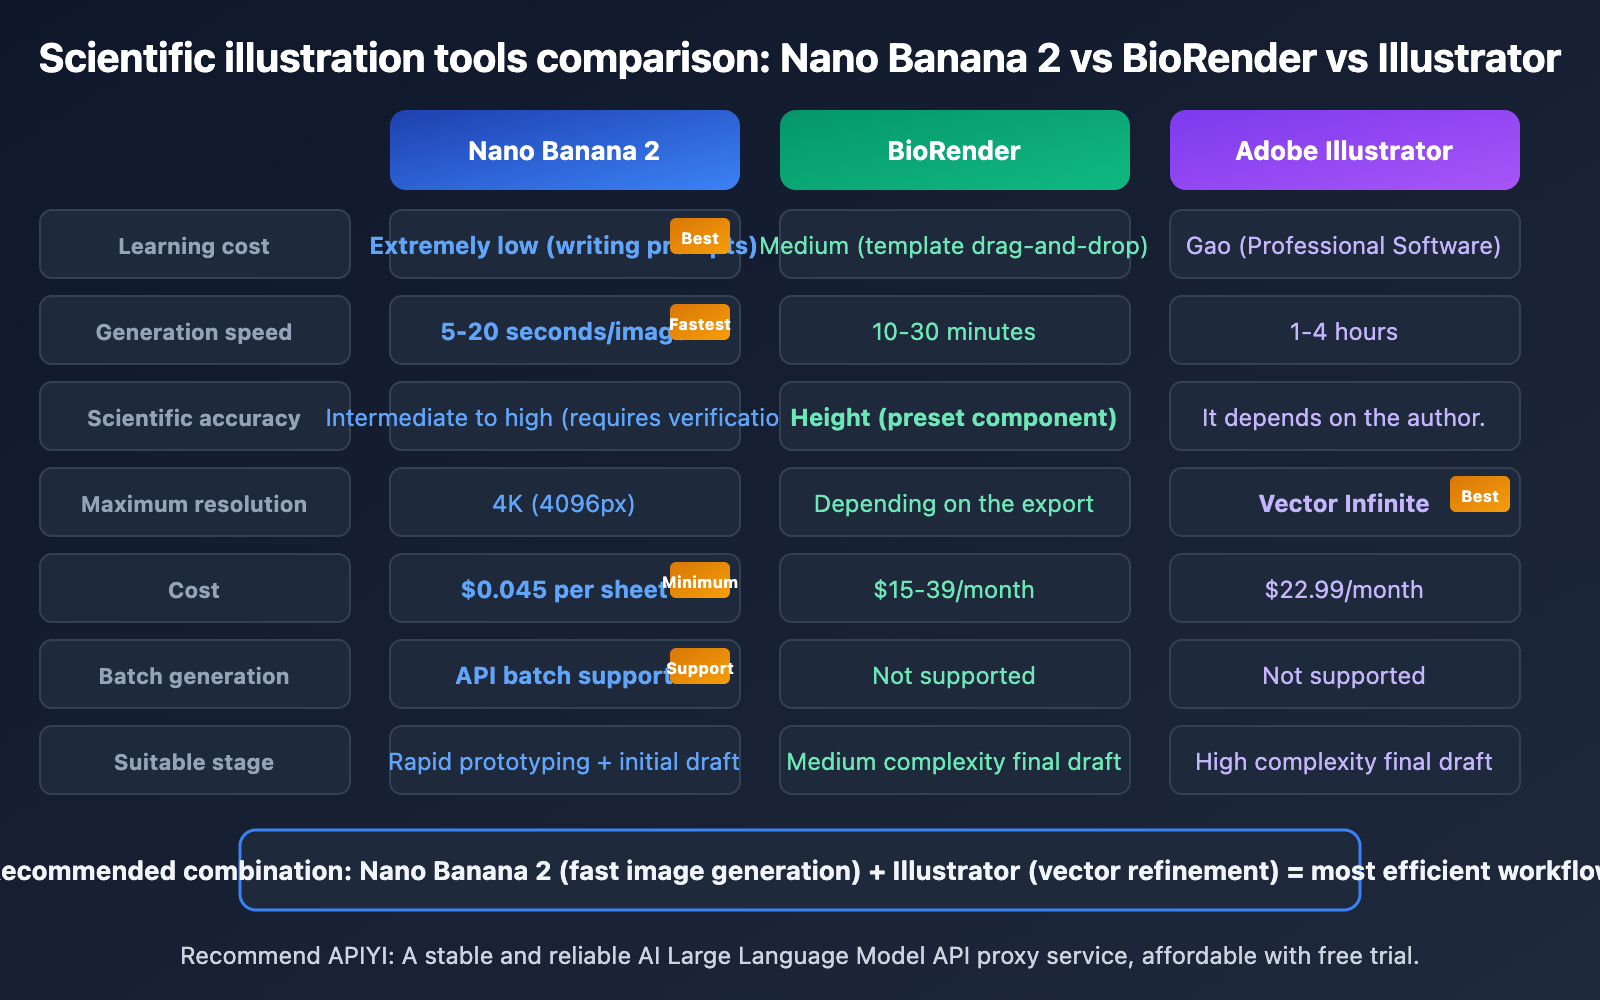
| Comparison Item | Nano Banana 2 | BioRender | Adobe Illustrator |
|---|---|---|---|
| Learning Curve | Very Low (write prompts) | Medium (template drag-and-drop) | High (professional software) |
| Generation Speed | 5-20 seconds/image | 10-30 minutes/image | 1-4 hours/image |
| Scientific Accuracy | Medium-High (requires manual verification) | High (pre-set biological components) | Depends on the author |
| Text Rendering | 97%+ accuracy | 100% (manual input) | 100% (manual input) |
| Max Resolution | 4K (4096px) | Depends on export settings | Vector, infinite scaling |
| Chinese Labels | Supported (medium quality) | Supported | Perfectly supported |
| Cost | $0.045/image (APIYI) | $15-39/month | $22.99/month |
| Vector Output | No (bitmap PNG) | Partially supported | Perfect vector |
| Batch Generation | Supported via API | Not supported | Not supported |
| Suitable Stage | Rapid Prototyping + Drafts | Medium-complexity final drafts | High-complexity final drafts |
🎯 Selection Advice: We recommend the "Nano Banana 2 + Illustrator" combined workflow: First, use Nano Banana 2 to quickly generate a base version ($0.045/image) to confirm layout and content, then import it into Illustrator for vector refinement. Calling the model via the APIYI apiyi.com platform makes batch iteration extremely cost-effective.
Nano Banana 2 Scientific Illustration: Key Considerations for Top Journal Submissions
Current AI Image Policies in Top Journals
Top-tier journals have clear policies regarding AI-generated images. It's essential to understand these before submission:
| Journal | AI-Generated Image Policy | Disclosure Requirement | Exceptions |
|---|---|---|---|
| Nature | Not permitted in principle | Must be declared in Methods | AI tools based on traceable scientific datasets may be exempt, but must be labeled |
| Science | Not permitted without editorial permission | Must be declared upon submission | Papers researching AI/ML may apply for exceptions |
| Cell | Restricted use | Must be disclosed | Graphical Abstracts and schematics are acceptable after disclosure |
| Elsevier | Permitted but must be disclosed | In Methods or Acknowledgments section | Must be labeled as AI-generated and the tool used must be specified |
| PLOS ONE | Permitted but must be disclosed | In Methods section | Must ensure accuracy and declare the name of the AI tool |
Compliance Recommendations for Scientific Illustrations
- Always Disclose: In the Methods section, explicitly state: "Figure X was generated using Nano Banana 2 (Gemini 3.1 Flash Image Preview, Google DeepMind) and refined in Adobe Illustrator."
- Manual Verification: AI-generated scientific illustrations must be individually verified by the researcher for scientific accuracy. Do not blindly trust the output.
- Avoid Fabricating Data: AI can generate charts that look very "scientific" but contain fake data. It is strictly prohibited to present AI-generated data charts as real experimental data.
- Keep Process Records: Save the prompts and output images from each iteration in case reviewers have questions.
Frequently Asked Questions
Q1: Can I submit scientific illustrations generated by Nano Banana 2 directly?
Direct submission is not recommended. The recommended workflow is: Nano Banana 2 generates a 4K base image (~20 seconds) → Researcher verifies scientific accuracy → Refine details in Illustrator/Photoshop (adjust labels, add statistical markers, convert to vector) → Export to the target journal's required format (TIFF/EPS). Simultaneously, you must declare the use of AI tools in the Methods section. Using APIYI (apiyi.com) to call the model allows for rapid iteration, costing only $0.045 per call.
Q2: Does the generated image resolution meet the requirements of top journals?
Nano Banana 2 supports output up to 4K (4096×4096px). Calculating for Nature's requirement of a two-column width of 183mm at 300 DPI, the required pixels are 2165px, which 4K output easily satisfies. However, AI generates raster images (PNG). If the journal requires vector formats (EPS/AI), you'll need to convert them using Image Trace in Illustrator. It's recommended to generate the 4K version via APIYI (apiyi.com) to ensure sufficient resolution.
Q3: How can I ensure the scientific accuracy of AI-generated charts?
Use a three-step verification method:
- Structural Check: Verify that every component in a pathway/process exists and that the relationships are correct.
- Terminology Check: Ensure all labeled text uses standard academic terminology and is spelled correctly.
- Logic Check: Verify that arrow directions, activation/inhibition relationships, and causal chains align with established scientific facts.
AI-generated illustrations can sometimes contain content that "looks professional but is scientifically incorrect," which is the most critical risk to watch for.
Q4: How effective is Chinese text labeling?
Nano Banana 2's quality for rendering Chinese text is less stable than for English. Chinese labels may have issues like incomplete glyphs or uneven spacing. For submissions to domestic Chinese journals, it's recommended to generate the image with English labels in the prompt first, then manually replace them with Chinese in Illustrator. For international journal submissions, using English labels directly is fine, with an accuracy rate above 97%.
Summary
Key points for scientific illustration with Nano Banana 2:
- Use discipline-specific terminology in prompts: Precise terminology is crucial for generation quality; avoid colloquial descriptions.
- 4K + 4:3 meets top-tier journal standards: Native 4K output covers the 300 DPI requirements for Nature/Science/Cell.
- Multi-round iterative refinement: Modify only one aspect per round; 3-5 rounds can get you close to publication-ready quality.
- Hybrid workflow: AI generation + manual refinement: Use Nano Banana 2 for rapid prototyping and Illustrator for final polishing.
- Mandatory disclosure and verification: Top journals require declaring AI tool usage in the Methods section; scientific accuracy must be manually verified.
We recommend accessing Nano Banana 2 via the APIYI platform at apiyi.com, costing only $0.045 per image. Five rounds of iteration amount to less than $0.25. Compared to BioRender subscription fees and the time cost of traditional hand-drawing, this is an efficient starting point for scientific illustration.
📚 References
-
Google Nano Banana 2 Image Generation Documentation: Official API parameter and capability specifications.
- Link:
ai.google.dev/gemini-api/docs/image-generation - Description: Complete parameter explanations including resolution, aspect ratio, Thinking mode, etc.
- Link:
-
Nature Figure Submission Guidelines: Nature journal's figure format requirements.
- Link:
research-figure-guide.nature.com/figures/preparing-figures-our-specifications/ - Description: Detailed submission specifications including resolution, fonts, dimensions.
- Link:
-
Nature AI Policy: Nature's editorial policy on AI-generated content.
- Link:
nature.com/nature-portfolio/editorial-policies/ai - Description: Understand the latest policy requirements for AI-generated images in top journals.
- Link:
-
APIYI Nano Banana 2 Integration Documentation: APIYI platform's guide for calling Nano Banana 2.
- Link:
docs.apiyi.com/en/api-capabilities/nano-banana-2-image - Description: Includes pay-per-use and volume-based pricing plans, suitable for iterative use in scientific illustration.
- Link:
Author: APIYI Technical Team
Technical Exchange: For more AI scientific illustration tips and academic publishing tool recommendations, visit the APIYI documentation center at docs.apiyi.com.