作者注:详解如何用 Nano Banana 2 生成符合 Nature、Science、Cell 等顶级期刊要求的科研插图,包含 7 个提示词技巧、5 类图表模板和完整 API 调用代码
科研论文中,一张高质量的 Figure 往往决定了审稿人的第一印象。传统科研绘图依赖 BioRender、Adobe Illustrator 等工具,学习曲线陡峭且费用不菲。
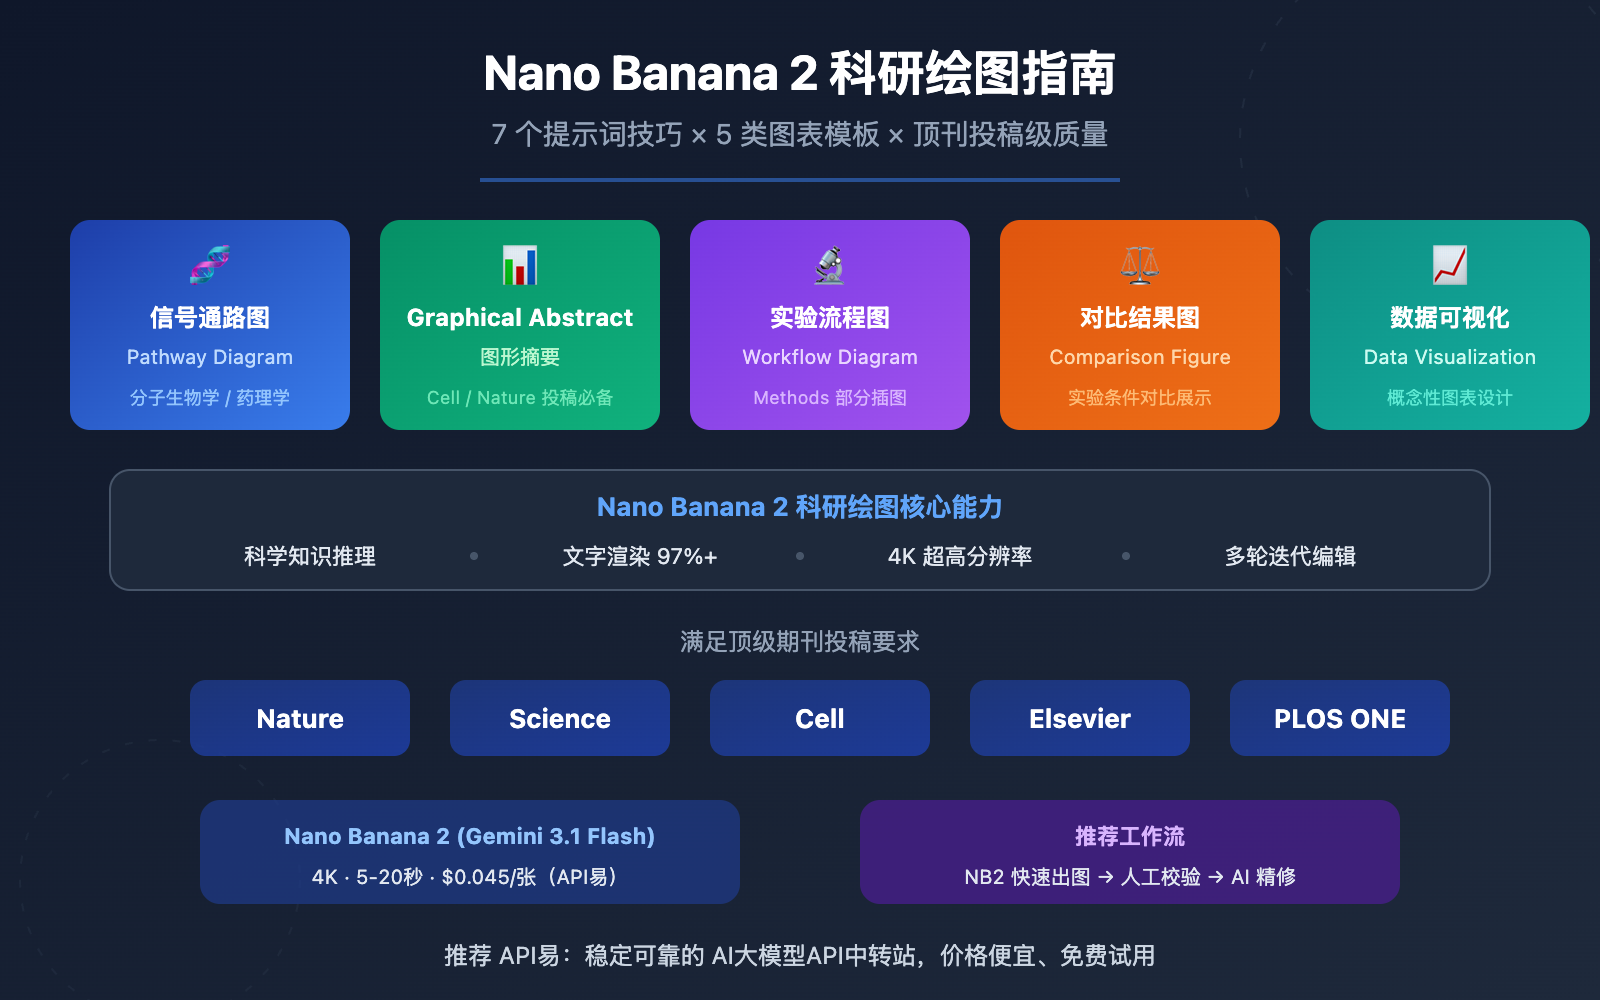
现在,Nano Banana 2 凭借内建的科学知识推理能力和精准文字渲染,正在成为科研工作者的新选择。从信号通路图到 Graphical Abstract,从实验流程图到数据可视化,一段提示词就能生成接近出版级质量的科研插图。
核心价值: 读完本文,你将掌握 7 个科研绘图提示词技巧,获得 5 类顶刊图表的提示词模板,并学会通过 API 批量生成和迭代优化科研插图的完整工作流。
Nano Banana 2 科研绘图 核心要点
| 要点 | 说明 | 价值 |
|---|---|---|
| 科学知识内建 | 基于 Gemini 3 架构,理解生物、化学、物理等学科概念 | 无需手动标注每个组件 |
| 文字渲染 97%+ | 英文标注几乎完美,支持多语言文字渲染 | 基因名、蛋白名、化学式准确呈现 |
| 4K 超高分辨率 | 原生支持 4096px 输出,满足 300 DPI 要求 | 直接达到顶刊投稿分辨率标准 |
| 多轮对话编辑 | 支持迭代修改,逐步调整细节 | 适合科研绘图的精细打磨流程 |
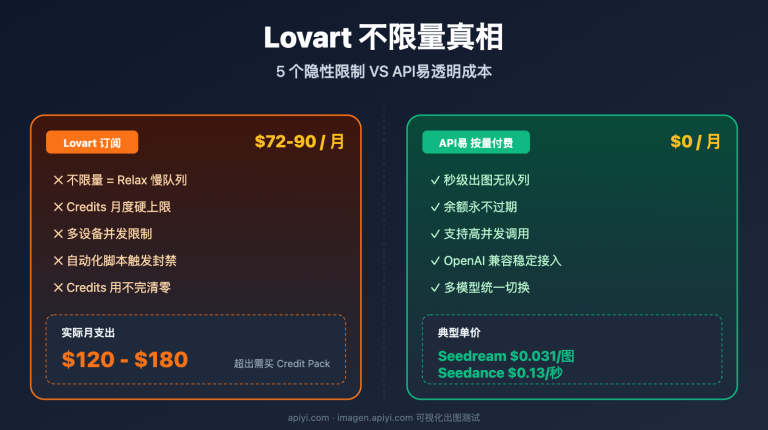
| 成本极低 | 单张 $0.045,迭代 10 次不到 $0.5 | 相比 BioRender $15/月订阅大幅节省 |
Nano Banana 2 科研绘图的核心优势
Nano Banana 2(Gemini 3.1 Flash Image Preview)与传统绘图工具最大的区别在于,它不只是一个「画图工具」,而是一个理解科学概念的绘图引擎。当你输入「MAPK/ERK signaling pathway with RAS activation」时,它能基于 Gemini 的知识库正确理解 RAS→RAF→MEK→ERK 的级联关系,自动生成合理的通路图布局,而不是简单地画几个方块和箭头。
这种「知识驱动」的生成方式对科研绘图至关重要——它意味着你可以把更多精力放在科学叙事的设计上,而不是纠结于每个组件的位置和连线。
Nano Banana 2 科研绘图的适用边界
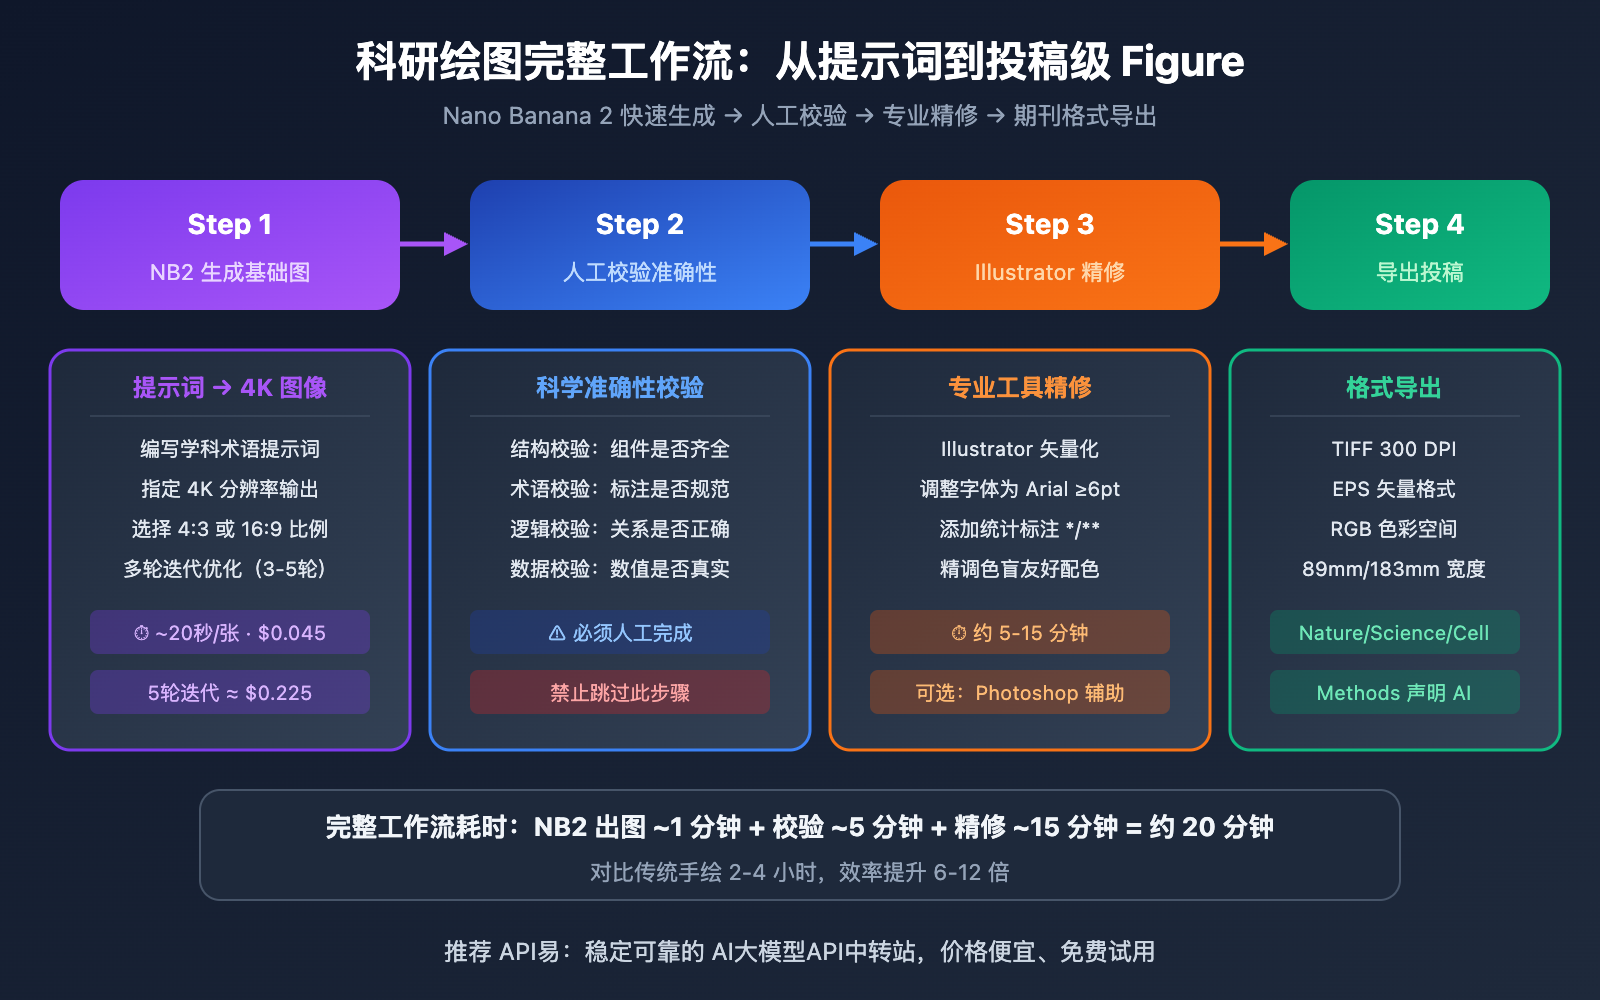
需要明确的是,AI 生成的科研插图目前更适合作为快速原型和基础版本,最终投稿级别的 Figure 通常需要在 Illustrator 或 Photoshop 中做精细调整。推荐工作流是:Nano Banana 2 快速生成 → 人工校验科学准确性 → 专业工具精修导出。
Nano Banana 2 科研绘图 7 个提示词技巧
以下 7 个技巧是科研绘图提示词的核心方法论,适用于所有类型的科研插图。
技巧 1:使用精准学科术语
科研绘图的提示词必须使用标准化的学科术语,而不是通俗描述。Nano Banana 2 基于 Gemini 的知识库能正确理解专业术语,并生成学术规范的图表。
| 通俗描述(效果差) | 学科术语(效果好) | 适用领域 |
|---|---|---|
| 细胞信号传递过程 | MAPK/ERK signaling cascade with phosphorylation events | 分子生物学 |
| DNA 复制的图 | Semi-conservative DNA replication fork with leading and lagging strand | 遗传学 |
| 药物作用机制 | Pharmacokinetic ADME pathway diagram | 药理学 |
| 蛋白质结构 | Protein tertiary structure with alpha-helix and beta-sheet domains | 结构生物学 |
| 化学反应过程 | SN2 nucleophilic substitution reaction mechanism with transition state | 有机化学 |
提示词示例:
Create a scientific schematic of the PI3K/AKT/mTOR signaling pathway.
Include: receptor tyrosine kinase activation, PI3K recruitment,
PIP2 to PIP3 conversion, AKT phosphorylation at Thr308 and Ser473,
mTORC1 and mTORC2 complexes, downstream targets S6K1 and 4E-BP1.
Use standard molecular biology iconography.
Arrows indicate activation, flat-headed lines indicate inhibition.
Clean white background, publication-quality, 4K resolution.
技巧 2:指定出版级别格式参数
不同顶刊对 Figure 有严格的格式要求。在提示词中直接指定这些参数,可以减少后期调整的工作量。
| 期刊 | 单栏宽度 | 双栏宽度 | 最低 DPI | 推荐格式 | 字体要求 |
|---|---|---|---|---|---|
| Nature | 89mm | 183mm | 300 DPI | TIFF/EPS | Arial/Helvetica ≥6pt |
| Science | 85mm | 174mm | 300 DPI | EPS/PDF | Helvetica ≥6pt |
| Cell | 85mm | 174mm | 300 DPI | TIFF/PDF | Arial ≥6pt |
| Elsevier | 90mm | 190mm | 300-1000 DPI | TIFF/EPS | Arial ≥8pt |
| PLOS ONE | 83mm | 173mm | 300 DPI | TIFF/PNG | Arial/Helvetica ≥8pt |
格式参数后缀(追加到任意科研绘图提示词末尾):
Output specifications: 4K resolution (4096px width),
white or light gray background,
Arial font family, minimum 8pt text size,
RGB color mode, high contrast,
clean layout with adequate white space,
suitable for Nature/Science journal submission
技巧 3:多轮对话迭代修改
科研绘图很少一次生成就完美。Nano Banana 2 支持多轮对话编辑,你可以在上一轮结果的基础上逐步调整。
迭代修改策略:
- 第 1 轮:生成基本结构和布局
- 第 2 轮:调整标注文字的大小和位置
- 第 3 轮:优化颜色方案,确保色盲友好
- 第 4 轮:精修细节,对齐元素间距
每轮只修改一个方面,避免一次提出过多修改导致模型混乱。例如:
Round 1: "Create a schematic of CRISPR-Cas9 gene editing mechanism..."
Round 2: "Make the guide RNA label larger, move it to the upper right"
Round 3: "Change the Cas9 protein color from blue to teal (#0d9488)"
Round 4: "Add a scale bar and increase spacing between PAM site label and the DNA"
技巧 4:指定学术配色规范
科研插图的配色需要遵循学术规范,同时确保色盲友好(约 8% 的男性存在红绿色盲)。
推荐学术配色方案:
Color scheme for scientific figure:
- Activation/positive: green (#10b981 to #34d399)
- Inhibition/negative: red (#ef4444 to #f87171)
- Neutral pathways: blue (#3b82f6 to #60a5fa)
- Highlighted element: orange (#f97316 to #fb923c)
- Background structures: gray (#94a3b8 to #cbd5e1)
Ensure colorblind accessibility (deuteranopia-safe).
Use hatching patterns as secondary visual encoding.
色盲友好原则:避免仅依靠红绿区分信息,使用蓝橙对比替代红绿对比,同时叠加形状或纹理作为辅助编码。
技巧 5:分模块生成复杂 Figure
顶刊论文的 Figure 通常包含多个 Panel(A、B、C、D),一次性生成复杂多面板图容易导致布局混乱。推荐分模块生成后再用 Illustrator 组合。
多面板 Figure 提示词模板:
Generate Panel [A/B/C/D] of a multi-panel scientific figure:
Panel content: [具体内容描述]
Panel size: 85mm x 85mm (square format)
Panel label: Bold letter "[A]" in top-left corner, 12pt Arial
Consistent color scheme: [配色说明]
White background, 4K resolution, clean borders
Leave 5mm margin on all sides for assembly
技巧 6:利用参考图提升准确性
Nano Banana 2 支持上传最多 14 张参考图片。对于科研绘图,上传已发表论文中类似的 Figure 作为风格参考,可以显著提升输出的学术风格一致性。
参考图使用方法:
- 上传 1-2 张目标期刊中类似主题的已发表 Figure
- 在提示词中说明
Follow the visual style and layout of the reference figure - 明确指出需要保留的元素和需要更改的内容
技巧 7:添加统计标注和图例
科研 Figure 通常需要统计标注(如显著性星号 、、)和图例。目前 AI 生成这些精细标注的准确率有限,建议在提示词中预留空间。
Leave space in the upper-right corner for a legend box (approximately 25mm x 15mm).
Leave space above each bar for statistical significance markers.
Do not generate placeholder statistics - I will add real p-values manually.
🎯 实战建议: 统计标注建议在后期用 Illustrator 手动添加,确保数值准确。通过 API易 apiyi.com 平台调用 Nano Banana 2 快速生成基础图后,在专业工具中完成最终精修。
Nano Banana 2 科研绘图 5 类图表模板
以下 5 类模板覆盖科研论文中最常见的 Figure 类型,直接复制提示词即可使用。
模板 1:信号通路机制图(Pathway Diagram)
适用于分子生物学、细胞生物学、药理学等领域。
Create a publication-quality schematic diagram of [PATHWAY NAME].

Components to include:
- [Receptor/protein 1] at the cell membrane
- [Kinase cascade: A → B → C → D]
- [Transcription factor] translocation to nucleus
- [Target gene] activation

Visual specifications:
- Cell membrane as a phospholipid bilayer at the top
- Cytoplasm in light beige, nucleus in light blue
- Activation arrows: solid green (#10b981), 2pt weight
- Inhibition lines: flat-headed red (#ef4444), 2pt weight
- Protein nodes: rounded rectangles with gradient fill
- All labels in Arial 10pt, black text on white background boxes
- White background, 4K resolution
- Style: Nature Reviews Molecular Cell Biology
模板 2:Graphical Abstract(图形摘要)
顶刊越来越多地要求提交 Graphical Abstract,用一张图概括研究核心发现。
Create a Graphical Abstract for a research paper about [RESEARCH TOPIC].

Layout: left-to-right narrative flow, 3 main sections
- Left section: [Input/Problem/Starting material]
- Center section: [Method/Process/Intervention]
- Right section: [Output/Result/Discovery]

Connect sections with bold directional arrows.
Use icons and simplified illustrations rather than text.
Minimal text labels, maximum 15 words total.
Color palette: [primary color] for main elements, [accent color] for highlights.
Size: landscape orientation, 16:9 aspect ratio.
Clean white background, modern flat design style.
4K resolution, suitable for Cell/Nature submission.
模板 3:实验流程图(Experimental Workflow)
适用于 Methods 部分的实验流程说明。
Create a step-by-step experimental workflow diagram for [EXPERIMENT NAME].

Steps (left to right or top to bottom):
1. [Step 1: Sample preparation - brief description]
2. [Step 2: Treatment/Processing - brief description]
3. [Step 3: Analysis method - brief description]
4. [Step 4: Data collection - brief description]
5. [Step 5: Results - brief description]

Visual style:
- Each step as a rounded rectangle with icon
- Connected by arrows with brief condition labels (e.g., "37°C, 24h")
- Timeline or duration indicators between steps
- Color-coded by phase: preparation (blue), experiment (green), analysis (purple)
- Clean white background, Arial font, 4K resolution
- Publication-ready for supplementary materials
模板 4:对比结果图(Comparison Figure)
适用于不同实验条件或方法的对比展示。
Create a scientific comparison figure showing [COMPARISON TOPIC].

Layout: side-by-side comparison, 2-3 conditions
- Condition A: [Control group description]
- Condition B: [Treatment group description]
- Condition C (optional): [Alternative treatment]

Include:
- Representative images/schematics for each condition
- Consistent scale and orientation across conditions
- Condition labels at the top (bold, 12pt)
- Key differences highlighted with colored annotations
- Scale bar in bottom-right corner
- White background, 4K resolution, Nature-style layout
模板 5:数据可视化概念图(Data Visualization Concept)
适用于复杂数据关系的概念性可视化(注意:精确数据图仍需 Python/R 生成)。
Create a conceptual data visualization diagram showing [DATA RELATIONSHIP].

Visualization type: [heatmap concept / network diagram / Venn diagram / scatter plot concept]
Key elements:
- [X-axis/Category 1]: [description]
- [Y-axis/Category 2]: [description]
- [Data trend/Pattern]: [description]

Style:
- Clean minimalist design
- Color gradient: [low value color] to [high value color]
- Clear axis labels and title
- Legend in top-right corner
- White background, 4K resolution
Note: This is a conceptual illustration. Real data plots should be generated with matplotlib/R.
💡 重要提醒: Nano Banana 2 擅长生成概念性科研插图(机制图、流程图、Graphical Abstract),但精确的统计图表(带真实数据的柱状图、散点图)仍推荐使用 Python matplotlib 或 R ggplot2 生成。AI 生成的数据可视化可能包含不准确的数值,需要严格校验。
Nano Banana 2 科研绘图 API 快速上手
极简示例
以下代码通过 API易 平台调用 Nano Banana 2 生成一张科研信号通路图:
import requests, base64

API_KEY = "your-apiyi-api-key"
ENDPOINT = "https://api.apiyi.com/v1beta/models/gemini-3.1-flash-image-preview:generateContent"

prompt = """Create a publication-quality schematic of the Wnt/beta-catenin signaling pathway.
Include: Wnt ligand, Frizzled receptor, Dishevelled, GSK-3beta destruction complex,
beta-catenin stabilization and nuclear translocation, TCF/LEF transcription.
Activation arrows in green, inhibition in red. White background, Arial font, 4K resolution."""

payload = {
    "contents": [{"parts": [{"text": prompt}]}],
    "generationConfig": {"responseModalities": ["IMAGE"], "imageConfig": {"aspectRatio": "4:3", "imageSize": "4K"}}
}

response = requests.post(ENDPOINT, headers={"Content-Type": "application/json", "x-goog-api-key": API_KEY}, json=payload, timeout=120)
image_data = response.json()["candidates"][0]["content"]["parts"][0]["inlineData"]["data"]
with open("wnt_pathway.png", "wb") as f:
    f.write(base64.b64decode(image_data))
查看多轮迭代修改的完整代码
import requests
import base64
import json

API_KEY = "your-apiyi-api-key"
ENDPOINT = "https://api.apiyi.com/v1beta/models/gemini-3.1-flash-image-preview:generateContent"

headers = {"Content-Type": "application/json", "x-goog-api-key": API_KEY}

def generate_figure(prompt, filename, aspect_ratio="4:3", size="4K"):
    """生成单张科研插图"""
    payload = {
        "contents": [{"parts": [{"text": prompt}]}],
        "generationConfig": {
            "responseModalities": ["IMAGE"],
            "imageConfig": {"aspectRatio": aspect_ratio, "imageSize": size}
        }
    }
    response = requests.post(ENDPOINT, headers=headers, json=payload, timeout=120)
    result = response.json()
    image_data = result["candidates"][0]["content"]["parts"][0]["inlineData"]["data"]
    with open(filename, "wb") as f:
        f.write(base64.b64decode(image_data))
    print(f"Saved: {filename}")
    return result

# ========== 多轮迭代示例 ==========

# Round 1: 生成基础版本
prompt_r1 = """Create a schematic of CRISPR-Cas9 gene editing mechanism.
Show: guide RNA binding to target DNA, Cas9 protein cutting double-strand,
PAM site recognition, and DNA repair pathways (NHEJ and HDR).
White background, publication quality, 4K resolution."""

generate_figure(prompt_r1, "crispr_v1.png")

# Round 2: 调整标注(传入上一轮图片作为参考)
prompt_r2 = """Based on the previous CRISPR diagram, make these changes:
1. Enlarge the guide RNA label to 12pt bold
2. Add a dashed box around the PAM site region
3. Use blue (#3b82f6) for NHEJ pathway, green (#10b981) for HDR pathway
4. Add small arrow labels for 'Blunt-end joining' and 'Template-directed repair'
Keep all other elements unchanged. 4K resolution."""

# 读取上一轮图片作为参考输入
import pathlib
prev_image = pathlib.Path("crispr_v1.png").read_bytes()
payload_r2 = {
    "contents": [{
        "parts": [
            {"inlineData": {"mimeType": "image/png", "data": base64.b64encode(prev_image).decode()}},
            {"text": prompt_r2}
        ]
    }],
    "generationConfig": {
        "responseModalities": ["IMAGE"],
        "imageConfig": {"aspectRatio": "4:3", "imageSize": "4K"}
    }
}
response_r2 = requests.post(ENDPOINT, headers=headers, json=payload_r2, timeout=120)
result_r2 = response_r2.json()
image_r2 = result_r2["candidates"][0]["content"]["parts"][0]["inlineData"]["data"]
with open("crispr_v2.png", "wb") as f:
    f.write(base64.b64decode(image_r2))
print("Saved: crispr_v2.png (iteration 2)")
建议: 科研绘图通常需要 3-5 轮迭代才能达到满意效果。通过 API易 apiyi.com 调用 Nano Banana 2,按次计费 $0.045/次,5 轮迭代成本仅 $0.225(约 1.6 元),远低于 BioRender 等专业工具的月费。
Nano Banana 2 科研绘图 与传统工具对比
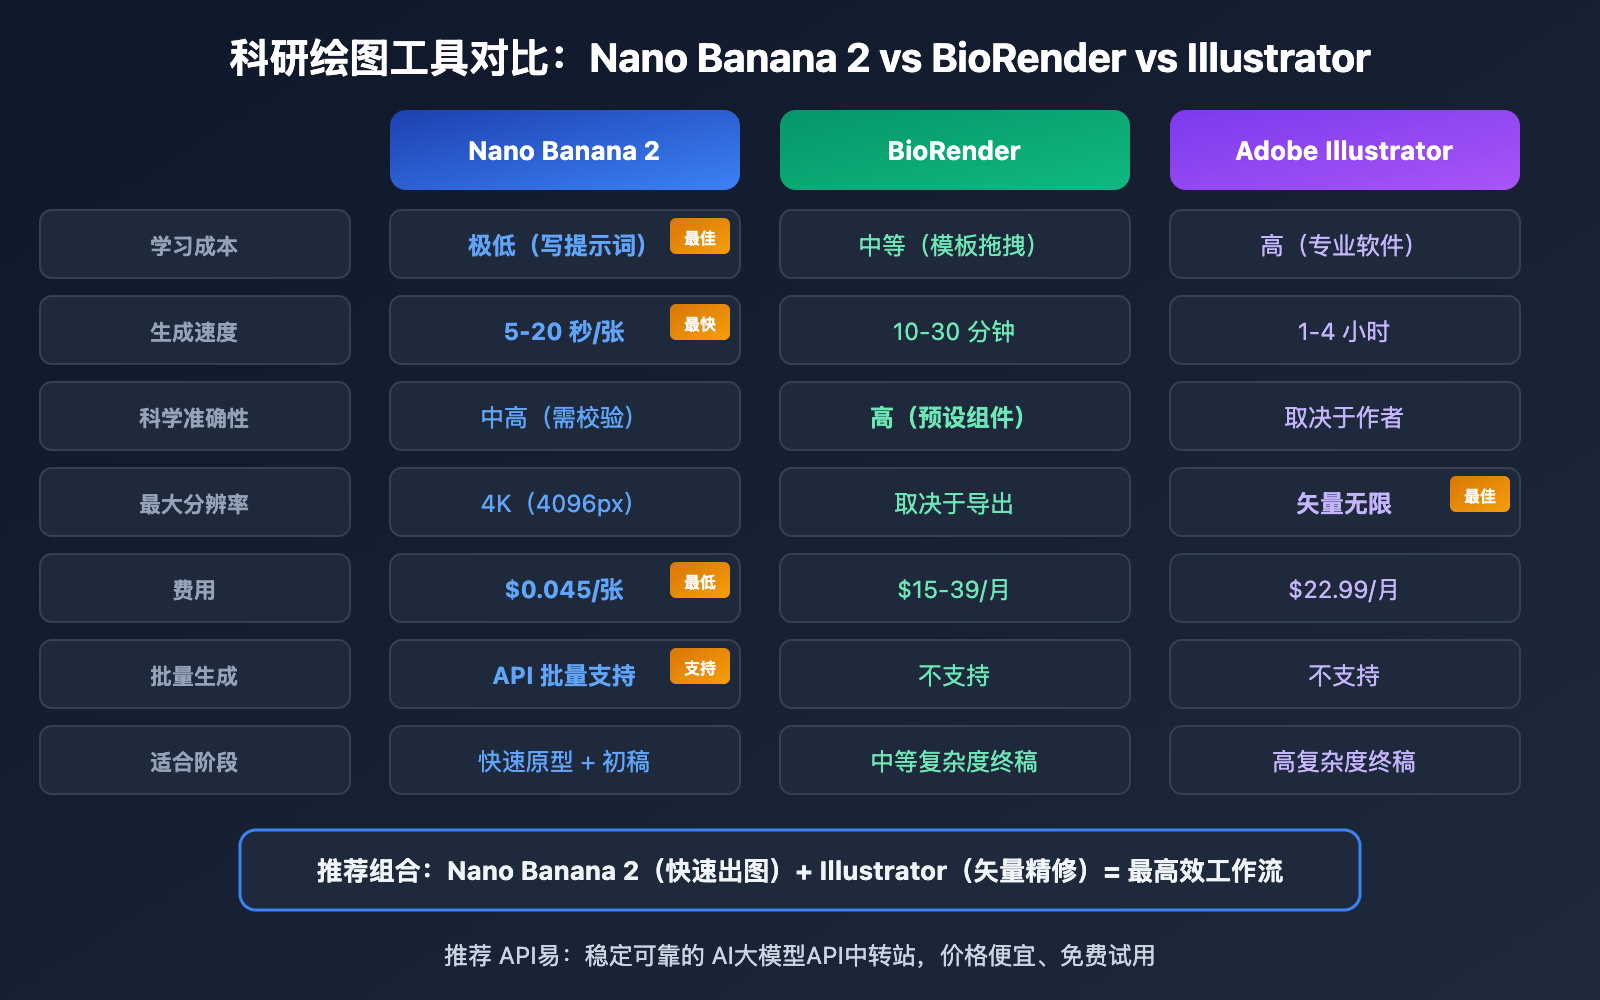
| 对比项 | Nano Banana 2 | BioRender | Adobe Illustrator |
|---|---|---|---|
| 学习成本 | 极低(写提示词) | 中等(模板拖拽) | 高(专业软件) |
| 生成速度 | 5-20 秒/张 | 10-30 分钟/张 | 1-4 小时/张 |
| 科学准确性 | 中高(需人工校验) | 高(预设生物组件) | 取决于作者 |
| 文字渲染 | 97%+ 准确率 | 100%(手动输入) | 100%(手动输入) |
| 最大分辨率 | 4K(4096px) | 取决于导出设置 | 矢量无限缩放 |
| 中文标注 | 支持(质量中等) | 支持 | 完美支持 |
| 费用 | $0.045/张(API易) | $15-39/月 | $22.99/月 |
| 矢量输出 | 否(位图 PNG) | 部分支持 | 完美矢量 |
| 批量生成 | 支持 API 批量 | 不支持 | 不支持 |
| 适合阶段 | 快速原型 + 初稿 | 中等复杂度终稿 | 高复杂度终稿 |
🎯 选择建议: 推荐「Nano Banana 2 + Illustrator」组合工作流:先用 Nano Banana 2 快速生成基础版本($0.045/张),确认布局和内容后再导入 Illustrator 做矢量化精修。通过 API易 apiyi.com 平台调用模型,批量迭代成本极低。
Nano Banana 2 科研绘图 顶刊投稿注意事项
期刊 AI 图像政策现状
顶级期刊对 AI 生成图像有明确的政策规定,投稿前必须了解:
| 期刊 | AI 生成图像政策 | 披露要求 | 例外情况 |
|---|---|---|---|
| Nature | 原则上不允许 | 必须在 Methods 中声明 | 基于可溯源科学数据集的 AI 工具可豁免,需标注 |
| Science | 未经编辑许可不允许 | 投稿时声明 | 研究 AI/ML 的论文可申请例外 |
| Cell | 限制使用 | 必须披露 | Graphical Abstract 和示意图经披露后可接受 |
| Elsevier | 允许但须披露 | Methods 或致谢部分 | 须标注为 AI 生成并说明使用的工具 |
| PLOS ONE | 允许但须披露 | Methods 部分 | 须确保准确性并声明 AI 工具名称 |
科研绘图的合规建议
- 始终披露:在 Methods 部分明确写出「Figure X was generated using Nano Banana 2 (Gemini 3.1 Flash Image Preview, Google DeepMind) and refined in Adobe Illustrator」
- 人工校验:AI 生成的科研插图必须由研究者逐一校验科学准确性,不能盲目信任
- 避免伪造数据:AI 可以生成看起来非常「科学」的假数据图表,严禁将 AI 生成的数据图充当真实实验数据
- 保留过程记录:保存每轮迭代的提示词和输出图片,以备审稿人询问
常见问题
Q1: Nano Banana 2 生成的科研插图能直接投稿吗?
不建议直接投稿。推荐工作流是:Nano Banana 2 生成 4K 基础图(约 20 秒)→ 研究者校验科学准确性 → Illustrator/Photoshop 精修细节(调整标注、添加统计标记、转矢量)→ 导出目标期刊要求的格式(TIFF/EPS)。同时必须在 Methods 部分声明使用了 AI 工具。通过 API易 apiyi.com 调用模型快速迭代,每次仅需 $0.045。
Q2: 生成的图片分辨率能满足顶刊要求吗?
Nano Banana 2 最高支持 4K(4096×4096px)输出。以 Nature 要求的双栏宽度 183mm、300 DPI 计算,所需像素为 2165px,4K 输出完全满足。但 AI 生成的是位图(PNG),如果期刊要求矢量格式(EPS/AI),需要在 Illustrator 中使用 Image Trace 转换。建议通过 API易 apiyi.com 生成 4K 版本,确保分辨率充足。
Q3: 如何保证 AI 生成图表的科学准确性?
三步校验法:
- 结构校验:检查通路/流程中的每个组件是否存在、关系是否正确
- 术语校验:检查所有标注文字是否为标准学术术语,拼写是否正确
- 逻辑校验:检查箭头方向、激活/抑制关系、因果链是否符合已知科学事实
AI 生成的插图可能出现「看起来专业但科学上错误」的内容,这是最需要警惕的风险。
Q4: 中文标注的效果如何?
Nano Banana 2 对中文文字渲染的质量不如英文稳定,中文标注可能出现字形不完整或间距不均等问题。对于国内期刊投稿,建议在提示词中先用英文标注生成,然后在 Illustrator 中手动替换为中文。国际期刊投稿直接使用英文标注即可,准确率 97% 以上。
总结
Nano Banana 2 科研绘图的核心要点:
- 用学科术语写提示词:精准术语是生成质量的关键,避免通俗描述
- 4K + 4:3 满足顶刊标准:原生 4K 输出覆盖 Nature/Science/Cell 的 300 DPI 要求
- 多轮迭代精修:每轮只改一个方面,3-5 轮即可接近出版级质量
- AI 生成 + 手动精修的混合工作流:快速出图用 Nano Banana 2,最终精修用 Illustrator
- 必须披露和校验:顶刊要求在 Methods 中声明 AI 工具使用,科学准确性必须人工把关
推荐通过 API易 apiyi.com 平台调用 Nano Banana 2,单张仅 $0.045,5 轮迭代不到 $0.25。相比 BioRender 订阅费和传统手绘的时间成本,是科研绘图的高效起点。
📚 参考资料
-
Google Nano Banana 2 图像生成文档: 官方 API 参数和能力说明
- 链接:
ai.google.dev/gemini-api/docs/image-generation - 说明: 包含分辨率、宽高比、Thinking 模式等完整参数说明
- 链接:
-
Nature 投稿 Figure 指南: Nature 期刊的图表格式要求
- 链接:
research-figure-guide.nature.com/figures/preparing-figures-our-specifications/ - 说明: 包含分辨率、字体、尺寸等详细投稿规格
- 链接:
-
Nature AI 政策: Nature 对 AI 生成内容的编辑政策
- 链接:
nature.com/nature-portfolio/editorial-policies/ai - 说明: 了解顶刊对 AI 生成图像的最新政策要求
- 链接:
-
API易 Nano Banana 2 接入文档: API易平台的 Nano Banana 2 调用指南
- 链接:
docs.apiyi.com/en/api-capabilities/nano-banana-2-image - 说明: 包含按次和按量计费方案,适合科研绘图的迭代使用
- 链接:
作者: APIYI 技术团队
技术交流: 更多 AI 科研绘图技巧和学术出版工具推荐,欢迎访问 API易 docs.apiyi.com 文档中心