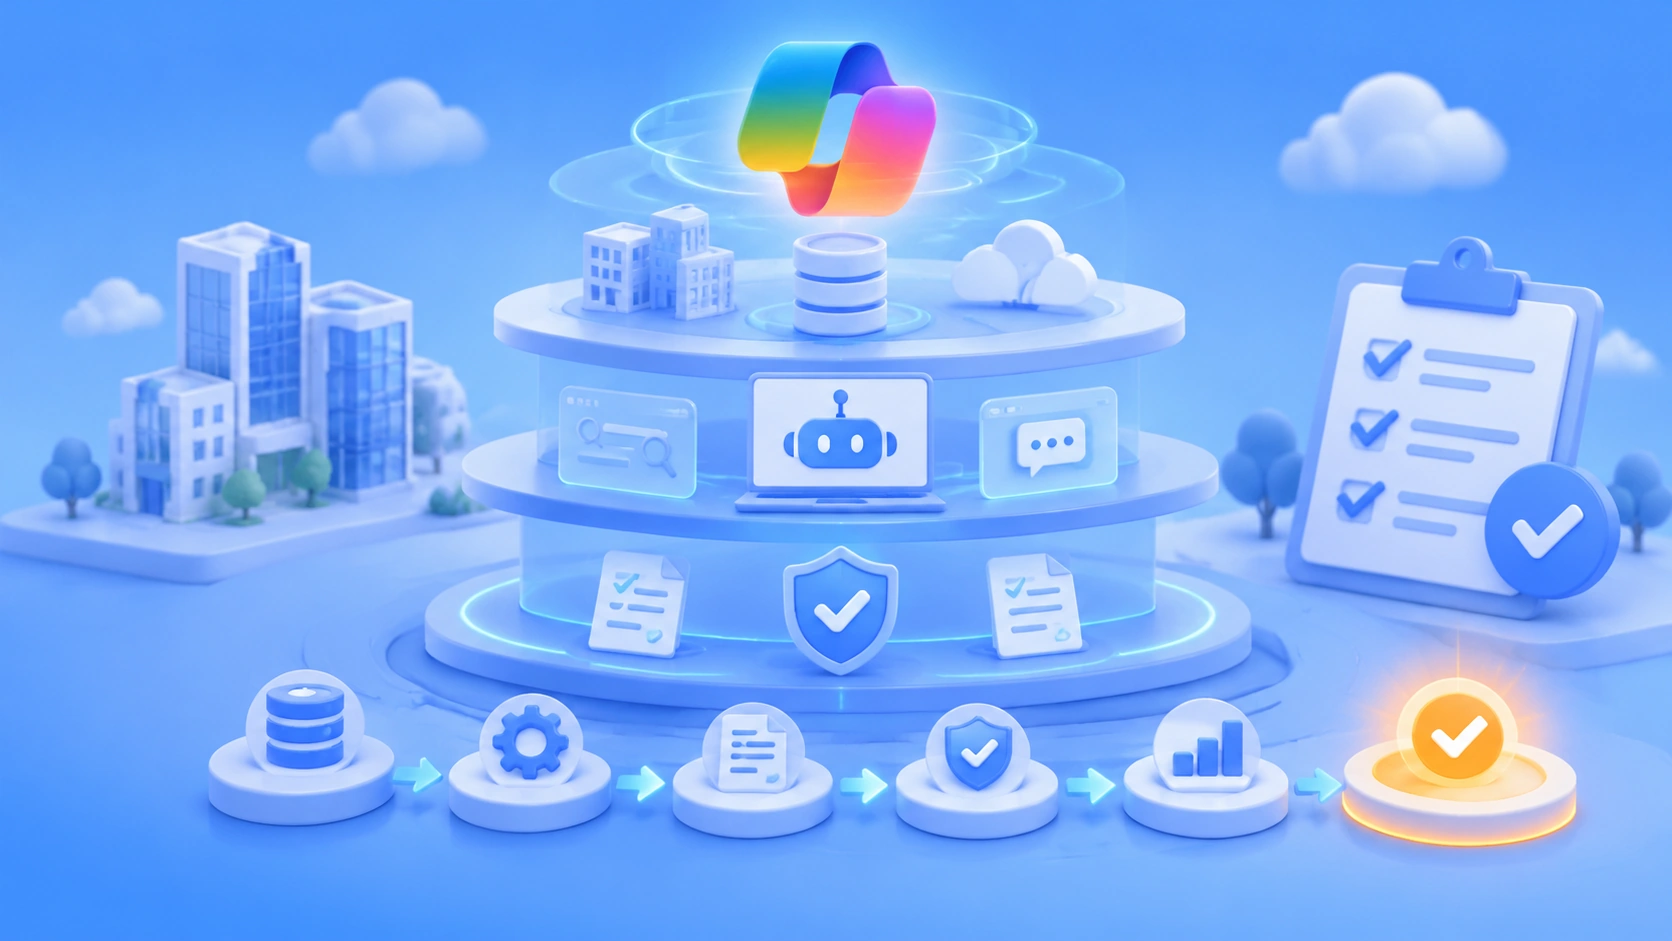
Author’s note: Using Microsoft Copilot’s publicly described synthetic enterprise environment as an example, this article breaks down its three-layer approach—synthetic environments, automated query generation, and quality checks—and offers evaluation set building steps and a checklist for small and midsize teams.
When an enterprise AI assistant or knowledge application is getting ready to launch, the people evaluating it often face a dilemma: the data that best reflects real-world performance—company emails, meeting notes, and project documents—contains sensitive information that can’t be used for testing. But generic benchmark scores won’t reveal problems specific to the business, either. Using a Microsoft Research blog post published on October 30, 2026, as an example, this article breaks down an evaluation set building approach based on synthetic enterprise environments + automated query generation + quality checks.
This isn’t a recap of the official marketing. Microsoft’s public materials focus on the methodological framework; they don’t provide prompts or tool code, and they don’t disclose Copilot’s specific metrics on these datasets. We’ll distinguish what the original post explicitly states from our own inferences, then distill the approach into steps small and midsize teams can use.
What you’ll take away: You’ll understand what each layer of a synthetic enterprise evaluation set does, why the time dimension and industry-specific context matter, and how to use a checklist to identify gaps in your own evaluation process.
Key Takeaways: Synthetic Enterprise Evaluation Datasets
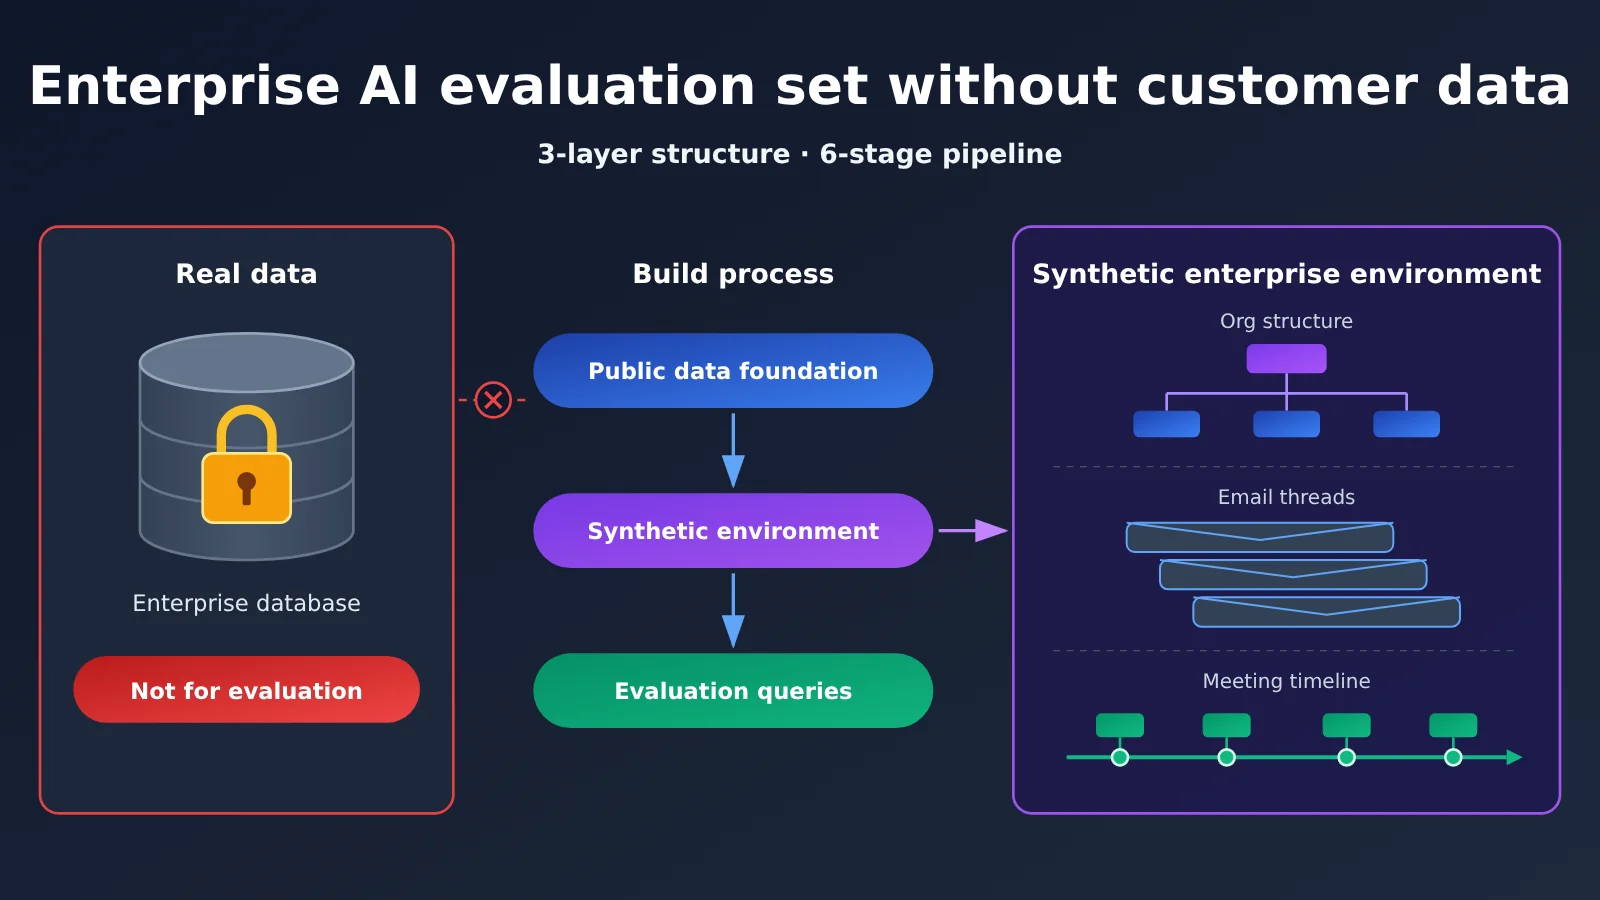
Microsoft calls this system the Industry Evaluation Data Generation Platform. It rests on three pillars, connected by a layer of end-to-end automation.
| Component | Description | Problem it solves |
|---|---|---|
| Synthetic enterprise environment | A simulated Copilot workspace containing users, meetings, emails, documents, and an organizational structure, without using any customer data | Provides a testable foundation without compromising privacy |
| Automated query generation pipeline | Turns general query ideas into industry-specific questions grounded in the environment’s data | Writing thousands of data-grounded queries by hand is too costly |
| Structured quality framework | Measures the quality of synthetic data across multiple dimensions | Prevents misleading conclusions based on implausible data |
| End-to-end automation | Regenerates the exact same dataset from the same configuration | Enables regression comparisons across versions and consistency across teams |
Why Generic Benchmarks Miss Enterprise AI Application Issues
The challenge in enterprise scenarios isn’t single-turn question answering—it’s organizational context. When a user asks, “Organize the action items from this security review meeting for each team,” the model needs to know who attended, who’s responsible for each module, and what specific items were discussed. It also needs to cite the original meeting notes in its response. Microsoft’s example involves a healthcare organization asking Copilot to summarize a meeting and extract action items, testing whether the response is accurate, complete, and grounded in evidence.
Generic benchmarks lack reporting relationships, project history, communication habits, and domain-specific workflows. As a result, they can’t expose enterprise-specific failures like attributing Department A’s decisions to Department B or missing a key conclusion from a cross-functional meeting. Microsoft’s approach is to create an environment whose structure and behavior resemble a real enterprise when real data can’t be used.
Grounding Synthetic Enterprise Environments in Public Data
When a Large Language Model invents an organizational structure from scratch, the result often has a narrow range of roles, flat reporting lines, and repetitive work. Microsoft uses three types of public data to calibrate its synthetic environments. All three sources were reviewed and approved by its legal and policy teams.
| Public data source | Use in the original work | Alternative for smaller teams |
|---|---|---|
| O*NET occupational database (U.S. Department of Labor) | Make employee roles and responsibilities more realistic, calibrate the mix and frequency of work activities across roles, and tailor industry workflows | Build a role list from public job descriptions and occupational classification standards in your industry |
| Online job postings | Provide realistic job titles, reporting hierarchies, and department structures | Collect public job descriptions from the target industry and extract job levels and department structures |
| SEC filings | Determine organization size, business unit structure, and financial context | Refer to business segment and employee headcount descriptions in public companies’ annual reports |
In Microsoft’s terminology, each simulated workspace is called a “tenant”: an isolated organizational environment with its own users, data, and configuration. The original work emphasizes that these environments are extensible baselines that teams can continue to build on.
The Time Dimension: Why “What Was Decided Last Thursday?” Needs a Realistic Timeline
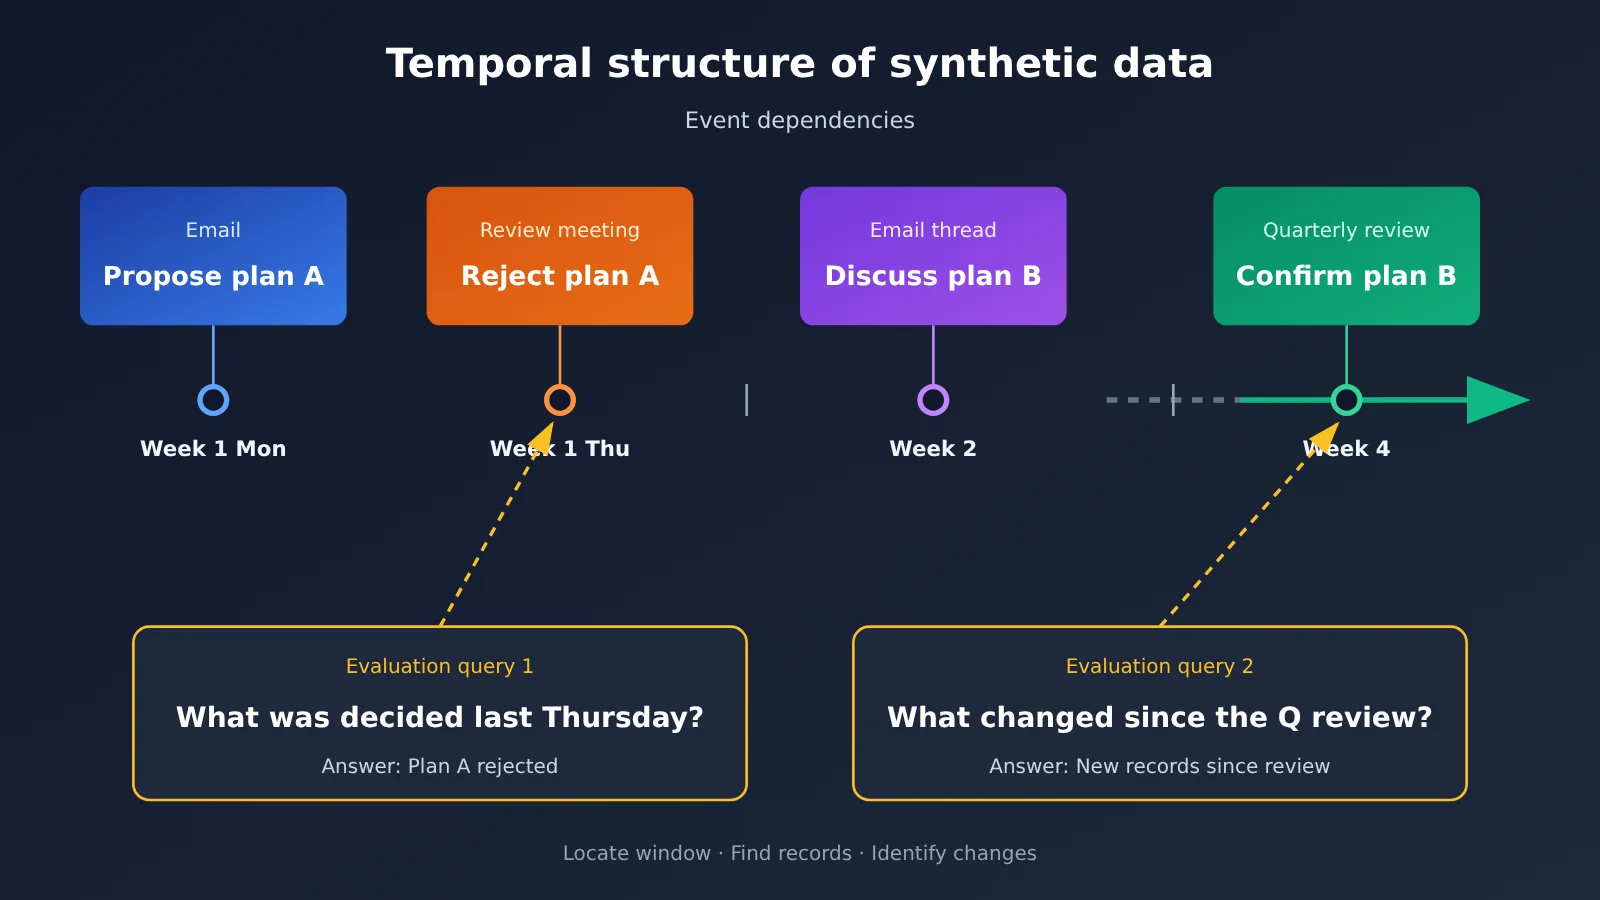
This is the point small and midsize teams should pay the most attention to. Microsoft’s synthetic environment isn’t a static snapshot—it’s an organization that evolves over time, with meeting histories, project timelines, email threads spanning weeks, and organizational changes that unfold naturally. The article notes that many Copilot queries are inherently time-based, such as “What did the team decide last Thursday?” and “What’s changed since the last quarterly review?”
Time-based questions require a model to do three things: identify the time window, find relevant records within it, and recognize what changed before and after. If synthetic data is just a pile of documents with no meaningful date relationships, or all meetings are crammed into the same day, these questions either have no definitive answer or are too easy to make the evaluation meaningful. The data needs dependencies across time—for example, a proposal is introduced on Monday, rejected at a meeting on Thursday, and replaced with an alternative in an email the following week. Only then can “What was decided last Thursday?” really test the model.
Industry-Specific Evaluation: The Same Model Reveals Different Problems Across Industries
Microsoft built synthetic environments for three industries, each based on real business workflows:
- Pharmaceuticals: Regulatory submissions, clinical trial discussions, and cross-functional safety review meetings
- Capital markets: Deal pipelines, compliance communications, and client portfolio reviews
- IT/software companies: Iteration planning, code review discussions, and product launch coordination
The original article argues that industry-specific environments make evaluation queries more representative of what users in each field actually ask. That helps uncover domain-specific failure modes that generic test cases miss. For an internal enterprise team, you typically serve only one or two industries, which makes it easier to go deeper.
Automated Query Generation: Breaking Down the Six-Stage Pipeline
Once you have a synthetic environment, you still need evaluation queries. The original article notes that writing thousands of industry-specific queries grounded in the data by hand would be too costly and slow, so the team built an automated pipeline. The article provides only a brief overview of each stage. The table below organizes its description into six steps; refer to the original diagram for the exact breakdown.
| Stage | Key point from the original article | Simplified approach for small and midsize teams |
|---|---|---|
| 1. Task library | Start with a large set of generic workplace tasks | List 50–100 common employee tasks, such as summarizing meetings, finding decisions, and comparing versions |
| 2. Industry filtering | Select tasks relevant to a specific industry | Ask business stakeholders to select tasks relevant to their industry |
| 3. Domain rewriting | Rewrite tasks using domain-specific language and context | Add industry terminology and typical document types |
| 4. Environment-based generation | Use AI to generate queries grounded in data from the synthetic environment | Have the model read specific documents or threads before generating questions, along with reference answers and sources |
| 5. Naturalization | Rewrite queries to sound more like real questions | Add conversational phrasing, omissions, and references, such as “What happened to that proposal?” |
| 6. Validation | Check each query for accuracy and uniqueness | Remove duplicates and spot-check whether each answer has a unique basis in the data |
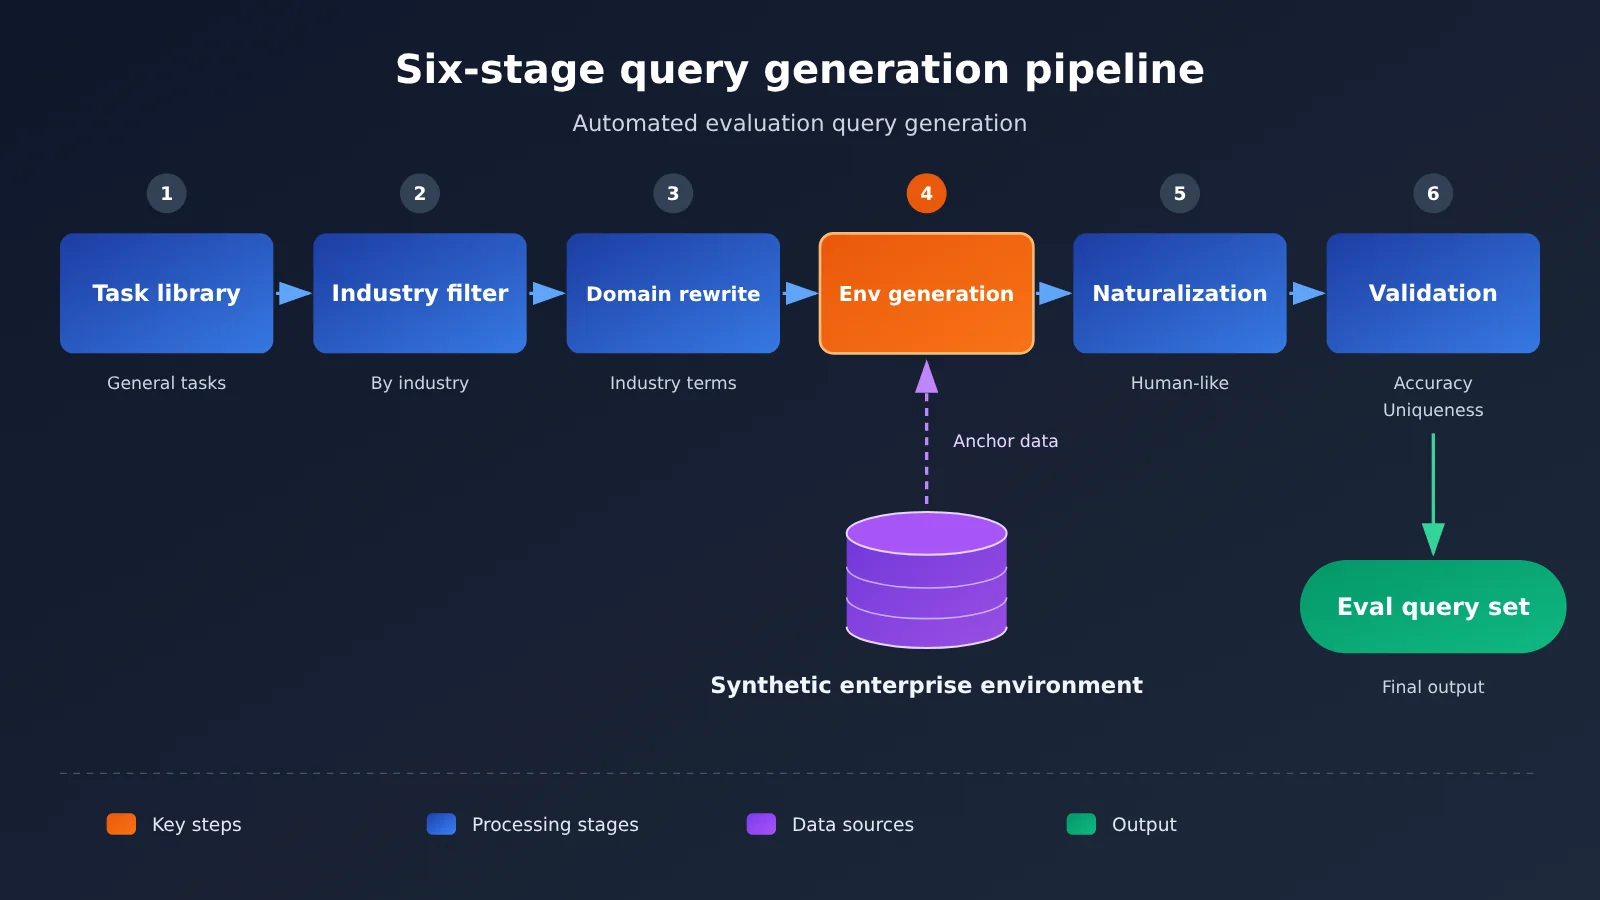
Step 4 is the key to the entire pipeline: queries must be grounded in specific data from the environment, or you can’t tell whether an answer is correct. The “uniqueness” check in step 6 is also easy to overlook. If the data supports multiple reasonable answers to the same question, scoring can become contentious.
For steps 4 and 5, you can use one model to generate questions and another to naturalize or validate them. This helps reduce bias from having the same model both ask and answer its own questions. When calling multiple models through the OpenAI-compatible interface from APIYI apiyi.com, switching models only requires changing the model name; the generation script can stay largely the same.
🎯 Technical tip: During query generation, fix the prompt template, model name, and parameters such as the random seed, and put them in a configuration file. That way, when you switch models for a comparison experiment, the model itself is the only variable. With APIYI’s unified interface, you can switch between models from different providers to generate and validate queries within the same workflow.
Synthetic Data Quality Checks: Test the Data Before the Model
Synthetic data needs to be evaluated too. Otherwise, a high model score might simply mean the data is too easy. The original article says its internal semantic evaluation framework measures quality across “three dimensions,” but it actually lists four. The table below includes all four; keep that discrepancy in mind when citing the source.
| Quality dimension | Question from the original article | Practical way to check |
|---|---|---|
| Structural fidelity | Does the organizational structure reflect realistic reporting hierarchies, team sizes, and cross-functional relationships? | Measure hierarchy depth and team-size distribution, then compare them with public data |
| Contextual relevance | Do queries and workflows represent real enterprise usage patterns? | Ask business users to blindly review sample queries and rate how much they resemble real questions |
| Behavioral realism | Do simulated users show human-like communication patterns and collaboration dynamics? | Check whether emails have reply chains and whether meetings include disagreements and follow-ups |
| Content safety | Is the data free of harmful, offensive, or personally identifiable information, and does it avoid impersonating real people? | Automatically scan for names, phone numbers, and ID number formats, then review the results manually |
The original article reports that the overall quality metric improved by 39% compared with the initial generation method, and some industry environments scored above 0.9 out of 1.0. It attributes the improvement to two factors: incorporating real industry signals and using the overall quality metric to drive automated quality improvements. These scores measure how closely the synthetic data resembles real enterprises—not Copilot’s performance. The original article doesn’t disclose Copilot’s metrics on these datasets.
Reproducibility: The Foundation for Cross-Version Regression Testing with Synthetic Evaluation Sets
The original article identified four practical problems with manual workflows:
- Reproducibility: Manual processes produce slightly different results each time, making cross-version comparisons difficult.
- Scale: The number of industry and configuration variants exceeds what people can handle manually.
- Iteration speed: Manual creation takes days, slowing down feedback.
- Cross-team consistency: Without standard tools, teams produce datasets with incompatible formats and quality levels.
After automation, dataset creation went from days of manual work to an automated run. Microsoft estimated savings of about $100,000 per evaluation dataset, or about $300,000 across the project. These estimates are based on Microsoft’s scale and can’t be applied directly to other teams. The article considered another result more important: any team can regenerate the dataset using the same configuration and get exactly the same data.
That’s critical for regression testing. If you change your retrieval strategy or switch models and scores drop, you need to know the change came from the system, not the data. If the test set differs slightly every time it’s regenerated, cross-version comparisons lose their meaning.
The same principle applies when comparing candidate models on APIYI: fix a single version of the synthetic evaluation set, then run each model against it. That way, the comparison reflects only differences between the models.
A Quick Start to Building a Synthetic Enterprise Evaluation Dataset for Small and Midsize Teams
Microsoft’s approach involves the complete communication histories of hundreds of users, three industry environments, legal review, and an internal shared directory. Small and midsize teams don’t need to replicate all of that. Here’s a simplified process based on the original method.
Setup Steps
- Define the scope: Choose one business scenario, such as “meeting notes Q&A” or “project document retrieval,” and stick to a single industry.
- Map the organization: Use public job postings and industry materials to design a fictional organization of 20–50 people. Specify departments, seniority levels, and reporting relationships.
- Build a timeline: Outline a 4–8 week project timeline with key events, decision points, and changes. Then use it to generate meeting notes, emails, and documents with consistent dependencies.
- Generate content: Use a Large Language Model to generate documents one by one along the timeline. Include metadata such as the date, author, and participants in each document.
- Generate queries: Create questions using the six-stage process above. Include a reference answer and source document ID for each question, and label time-related queries separately.
- Validate the data: Sample-check the data against the four quality dimensions. Run PII scanning across the entire dataset.
- Version everything: Record the organization setup, timeline, prompts, model names, and parameters in a configuration file, and assign a version number.
- Run the evaluation: Test the system on a fixed version of the dataset and record scores for each query category.
🚀 Quick start: Steps 4 and 5 require repeated Large Language Model calls. With the OpenAI-compatible interface from APIYI at apiyi.com, you can access multiple models using the same invocation method. Use one model for generation and switch to another for validation by changing only the model name.
Self-Check Checklist
- [ ] The evaluation data contains no real customer or employee data
- [ ] The organizational structure has multiple levels and cross-department collaboration, rather than a flat list of names
- [ ] The data has a realistic time structure, covers at least several weeks, and includes causal relationships between events
- [ ] Some queries are time-based, using phrases like “last week” or “since the last retrospective”
- [ ] Queries use terminology and document types specific to your industry
- [ ] Every query has a unique, verifiable reference answer and source
- [ ] The synthetic data itself has been quality-checked, rather than used as-is
- [ ] The same configuration can regenerate the same dataset
What Requires Large-Scale Investment, and What Can Be Simplified
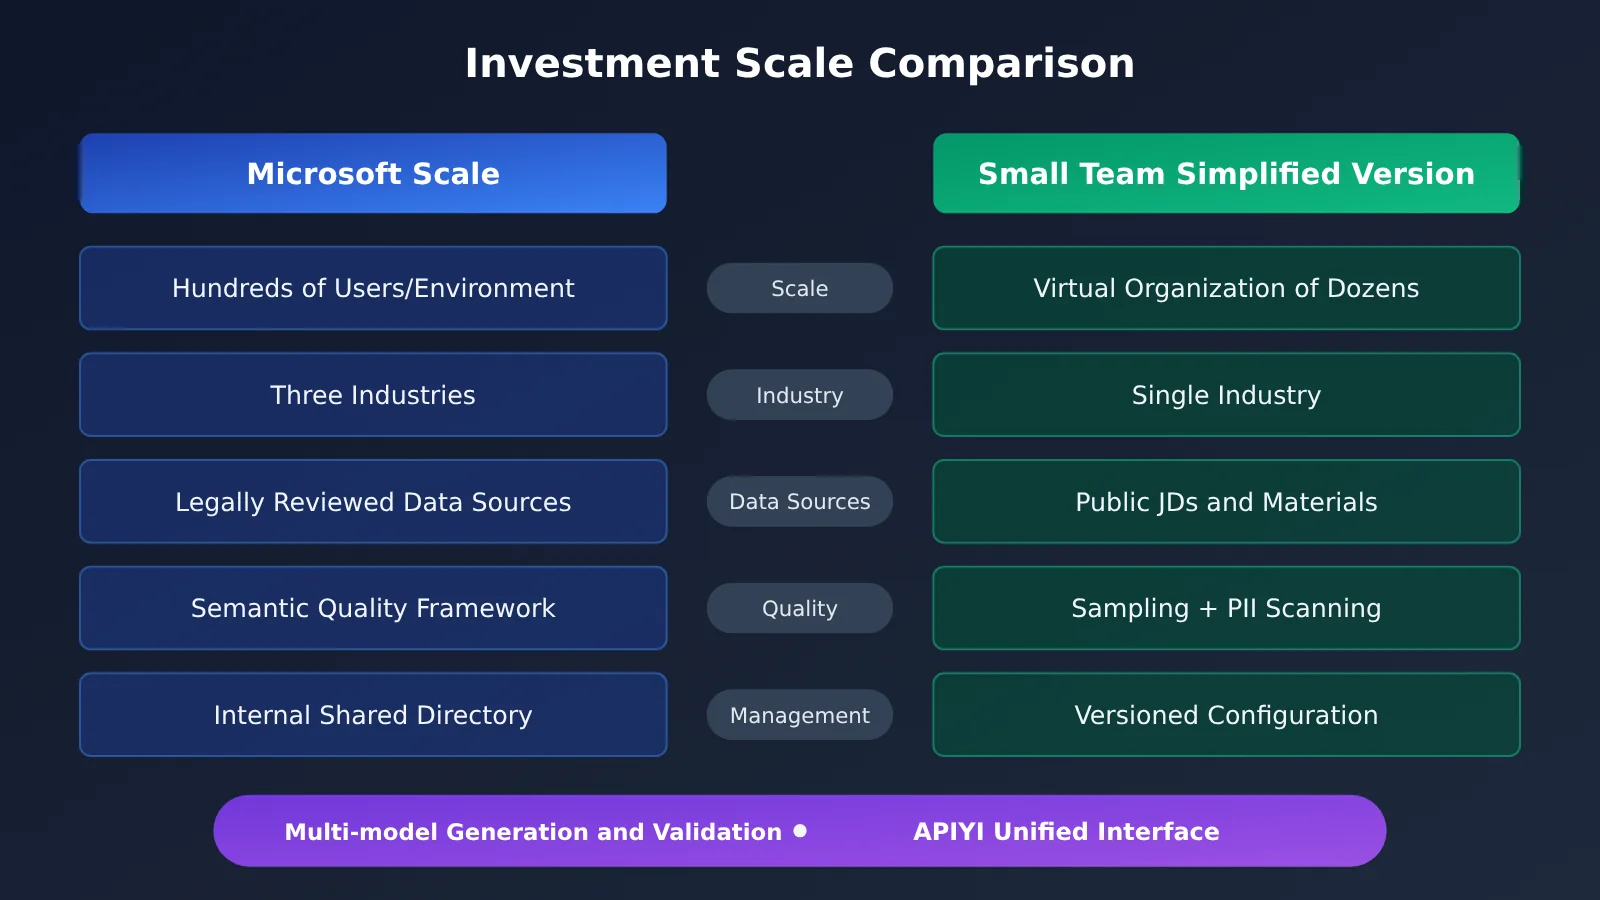
| Area | Microsoft’s approach | Investment | Recommendation for small and midsize teams |
|---|---|---|---|
| Public data sourcing | O*NET, job postings, and SEC filings, reviewed by legal | High | Manually compile industry materials, but still confirm that the sources can be used |
| Environment size | Hundreds of users per environment, with complete communication histories | High | A few dozen people are enough to cover the main roles |
| Industry coverage | Three industries | Medium | Focus on the one industry you serve |
| Quality framework | Internal semantic evaluation framework and comprehensive metrics | High | Manual sampling + simple statistics + automated PII scanning |
| Time structure | An organization that evolves over time | Essential | Write the timeline before generating content |
| Reproducibility | Same configuration produces the same result | Essential | Version configurations and cache generated results |
You can scale back the size and level of automation, but you can’t skip time structure, query anchoring, or reproducibility. These three factors determine whether evaluation results can support launch decisions. That said, there’s currently no public information on the actual cost or effectiveness of this approach for small and midsize teams. The recommendations above are extrapolated from the method in the original article.
Frequently Asked Questions
Q1: What is a synthetic enterprise environment evaluation set?
It’s a simulated enterprise workspace generated entirely by software. It includes employees, organizational structures, meetings, emails, and documents, along with a set of evaluation queries based on that data. It’s used to test whether enterprise AI applications can find, combine, and present the right information without accessing real customer data.
Q2: How does a synthetic evaluation set differ from a general benchmark?
General benchmarks are valuable for comparing broad capabilities, but they lack reporting relationships, project histories, and domain-specific workflows. A synthetic enterprise environment retains these structures, helping expose domain-specific failure modes that general test cases can miss, such as confusing department affiliations or overlooking decisions made in cross-functional meetings.
Q3: When did Microsoft make this approach public?
Microsoft Research published the related blog post on October 30, 2026. According to the post, the platform had been published to an internal shared catalog and became the first standardized evaluation baseline for Microsoft Copilot.
Q4: What scenarios is this approach best suited for?
– **Meeting notes Q&A**: Test the accuracy of summaries, action item extraction, and citations
– **Enterprise knowledge retrieval**: Test whether the system can find the one correct source among a large collection of documents
– **Time-based queries**: Test questions like “What was decided last week?” and “What has changed recently?”
– **Model or version regression testing**: Compare old and new approaches on a fixed dataset
Q5: How can I compare different models using the same synthetic evaluation set?
The key is to keep the dataset version fixed and change only the model being tested. APIYI apiyi.com provides a unified OpenAI-compatible interface that supports multiple mainstream models. You only need to change the model name to switch between them, so you can run the same evaluation script against each candidate model. You’ll still need to implement the scoring logic and evaluation framework yourself.
Q6: Can synthetic data distort evaluation results?
It can. That’s why the original post describes a quality framework that evaluates the data before evaluating the model. If synthetic data is too orderly and lacks realistic disagreements and noise, model scores can be artificially inflated. Consider asking business stakeholders to blindly review data samples and regularly calibrating the synthetic data against de-identified real-world feedback.
Q7: What are the known limitations of this approach?
The original post doesn’t disclose the prompts, tools, or implementation details for each stage of the pipeline, nor does it disclose Copilot’s evaluation metrics. The quality framework refers to “three dimensions” but lists four items. The reported cost savings are Microsoft’s own estimate. The post also notes that multi-turn agent interactions, organizational evolution over months or even years, and AI systems that take actions are evaluation challenges the team plans to address next.
Key Takeaways: Synthetic Enterprise Environment Evaluation Sets
- Three essential layers: Build a synthetic environment, automatically generate queries, and validate data quality. Without all three, the evaluation isn’t reliable.
- Calibrate against public data: Use occupational databases, job postings, and public financial reports to make organizational structures realistic.
- Don’t skip temporal structure: Time-based queries require data with realistic event sequences and causal relationships.
- Industry-specific queries reveal more: Queries grounded in a particular domain are more likely to expose domain-specific failures.
- Test the data before the model: Check synthetic data for structure, context, behavior, and safety.
- Reproducibility enables regression testing: The same configuration must generate the same data for comparisons across versions to be meaningful.
- Compare multiple models: Once the dataset is fixed, use APIYI’s unified interface to switch model names and run comparisons.
Summary
Microsoft Copilot’s approach to synthetic enterprise environments comes down to three principles:
- Use synthetic data to protect privacy: By never using customer data in the first place, teams can freely share and reuse datasets.
- Use structure to create realism: Organizational hierarchies, timelines, and industry workflows determine whether an evaluation can uncover real-world problems.
- Use automation to ensure reproducibility: The same configuration must produce the same dataset for evaluation results to support deployment decisions.
Small and midsize teams don’t need to replicate Microsoft’s scale, but three practices are worth adopting: temporal structure, query anchoring, and configuration versioning. Start with one scenario, one industry, and a virtual organization of a few dozen people. Run through the complete process once, then expand gradually.
Once the dataset is fixed, you can use APIYI at apiyi.com to access multiple models through the same OpenAI-compatible interface and compare their performance directly on the same synthetic evaluation set.
📚 References
- Microsoft Research Blog – From synthetic enterprise data evaluations to real Microsoft Copilot AI confidence: The source material for the methodology discussed in this article
- Link:
microsoft.com/en-us/research/blog/from-synthetic-enterprise-data-evaluations-to-real-microsoft-copilot-ai-confidence -
Notes: Describes the synthetic environment, six-stage pipeline, quality framework, privacy design, and results
-
O*NET Occupational Database: The U.S. Department of Labor’s occupational information database
- Link:
onetonline.org -
Notes: Used in the original work to calibrate the roles, responsibilities, and distribution of work activities for synthetic employees
-
SEC EDGAR Public Filing Search: Public disclosure filings from the U.S. Securities and Exchange Commission
- Link:
sec.gov/edgar - Notes: Used in the original work to establish the synthetic organization’s size, business unit structure, and financial background
Author: APIYI Technical Team
Technical discussions: For questions about unified access to multiple models, get in touch with us through APIYI at apiyi.com