Monitoring Nano Banana Pro API availability is a key requirement for developers to ensure the stable operation of their image generation services. This article introduces 3 practical methods for monitoring the Nano Banana Pro API, helping you track service status in real-time and respond quickly to outages.
Core Value: By the end of this article, you'll know how to use Google's official status pages and third-party tools like OpenRouter to build a complete availability monitoring system for the Nano Banana Pro API.
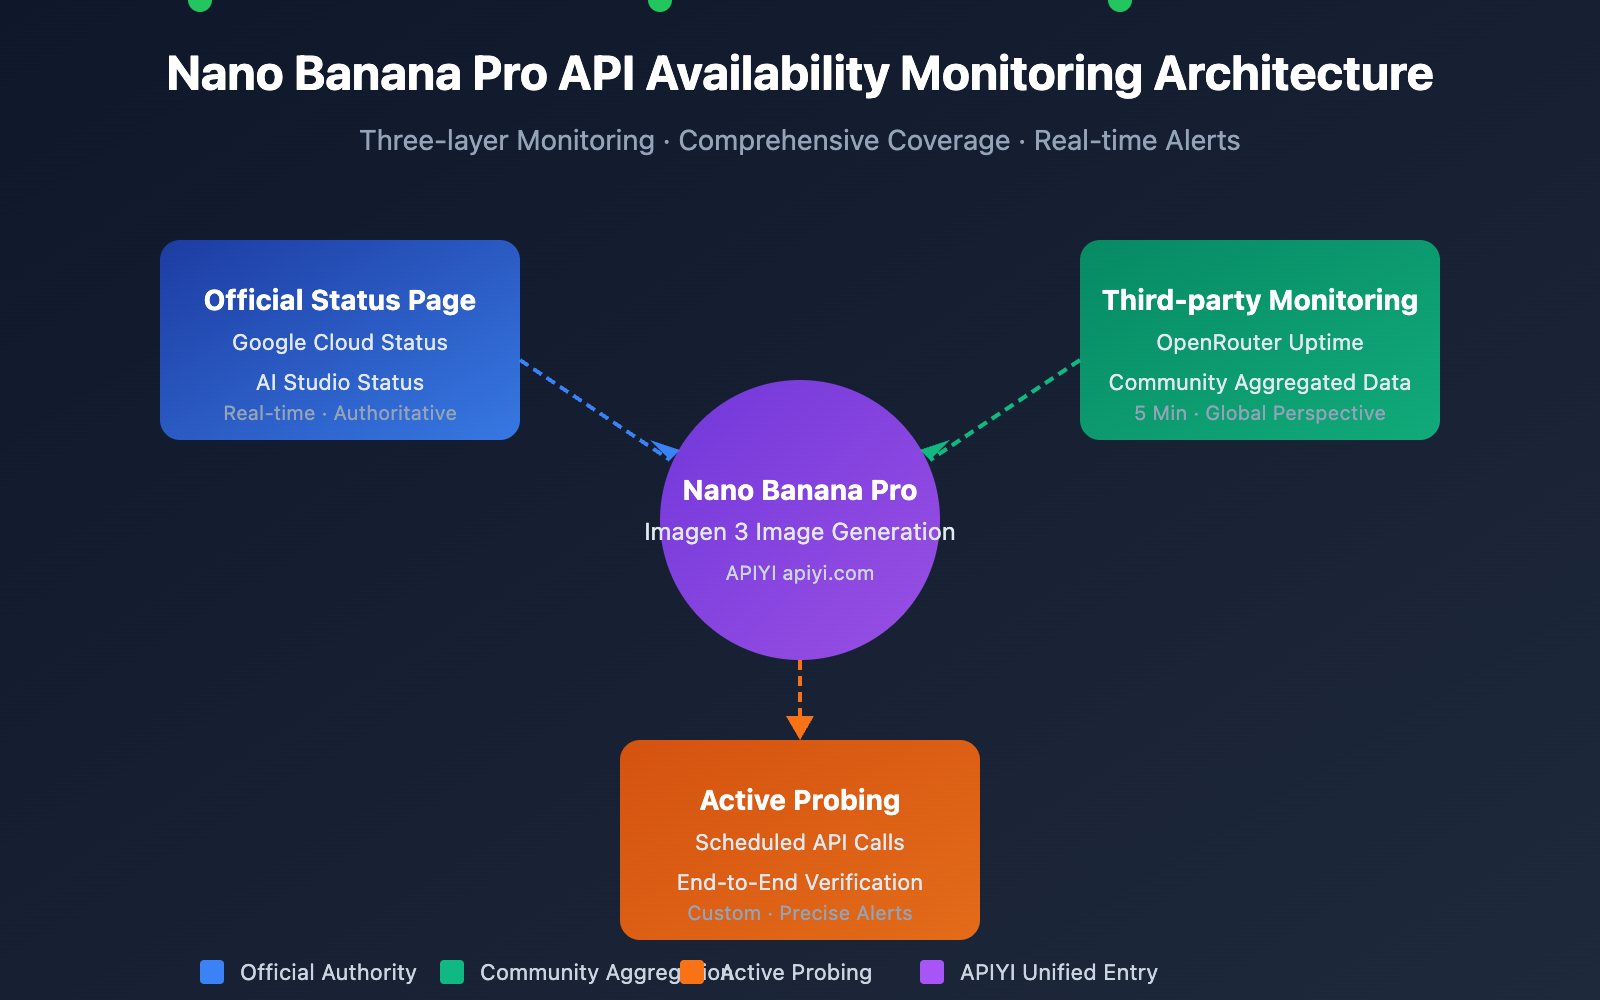
Key Essentials for Nano Banana Pro API Monitoring
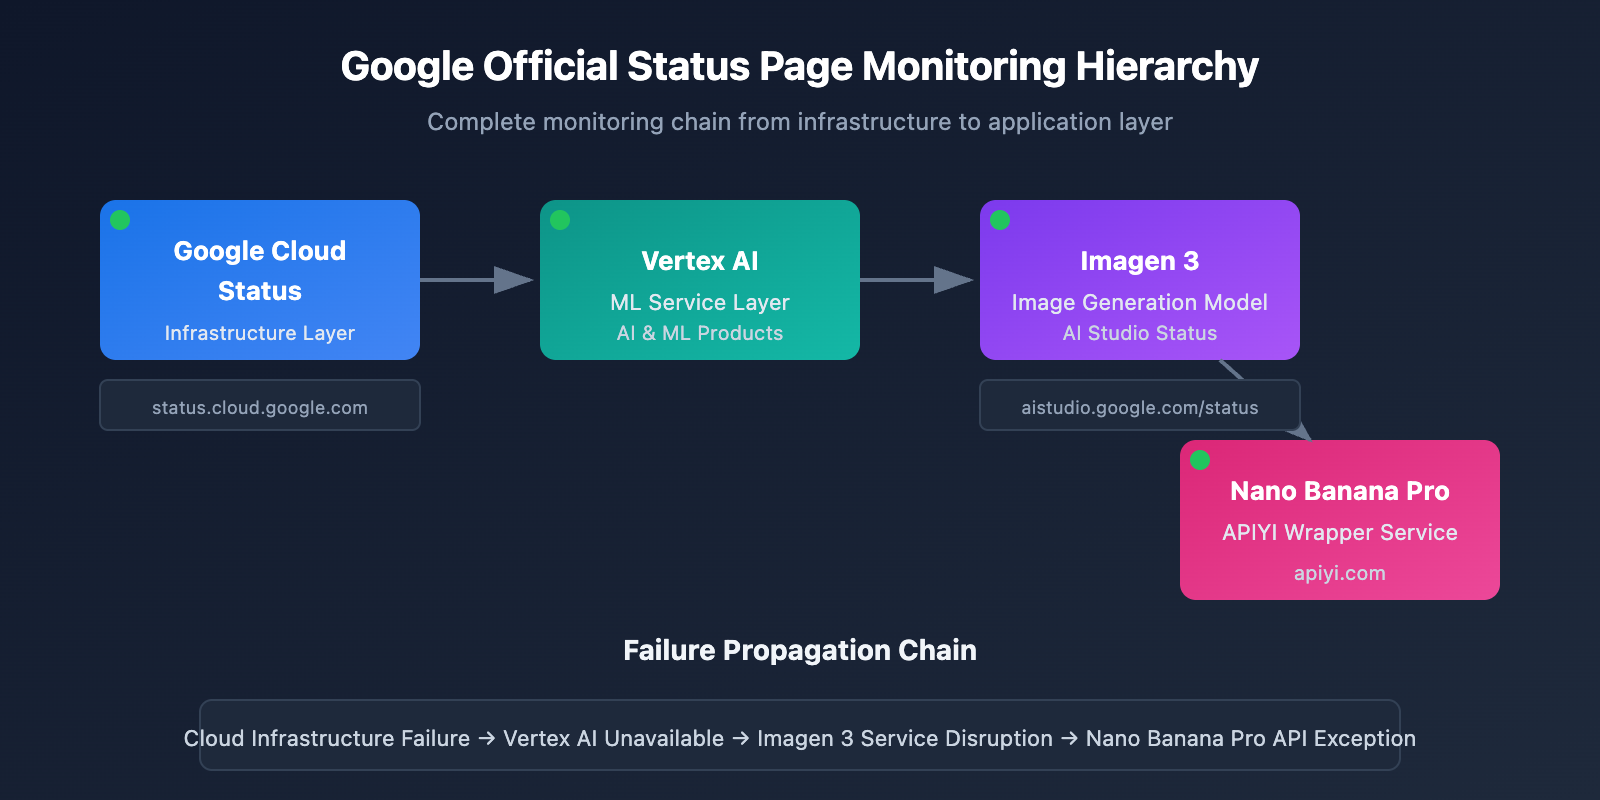
Nano Banana Pro (based on Google Imagen 3) is currently one of the most powerful AI image generation models out there. Since its backend depends on Google Cloud infrastructure, your monitoring strategy needs to cover several layers.
| Monitoring Layer | Source | Content | Update Frequency |
|---|---|---|---|
| Infrastructure Layer | Google Cloud Status | Computing, networking, storage services | Real-time |
| AI Service Layer | AI Studio Status | Gemini and Imagen model services | Real-time |
| Third-party Aggregation | OpenRouter Uptime | API response rates, latency stats | 5 minutes |
| Active Probing | Custom monitoring scripts | End-to-end availability testing | Customizable |
Key Metrics for Nano Banana Pro API Monitoring
When monitoring the Nano Banana Pro API, you'll want to focus on these core metrics:
| Metric Name | Normal Range | Alert Threshold | Description |
|---|---|---|---|
| API Availability | ≥ 99.5% | < 99% | Overall service availability |
| Response Latency | 5-15 seconds | > 30 seconds | Time taken for image generation |
| Error Rate | < 1% | > 5% | Percentage of failed requests |
| Rate Limit Hits | 0 times/hour | > 10 times/hour | Frequency of hitting Rate Limits |
🎯 Technical Tip: For production environments, we recommend calling the Nano Banana Pro API via the APIYI (apiyi.com) platform. It provides unified status monitoring and alerting, helping you avoid the costs and complexity of building your own monitoring system.
Nano Banana Pro API Monitoring Method 1: Official Google Status Page
Monitoring via Google Cloud Status
The Google Cloud Status page provides real-time status updates for Google's infrastructure, making it the go-to source for monitoring Nano Banana Pro's underlying services.
Official Status Page: status.cloud.google.com
Key Monitoring Services
| Service Name | Status Page Location | Impact Scope |
|---|---|---|
| Vertex AI | AI & Machine Learning | Directly impacts Imagen 3 |
| Cloud Storage | Storage | Impacts image storage and retrieval |
| Cloud Run | Compute | Impacts API gateway services |
| Cloud Load Balancing | Networking | Impacts request routing |
Status Subscription Settings
Google Cloud Status supports several ways to stay updated:
# Example: Get status using the Google Cloud Status API
import requests

def check_google_cloud_status():
    """
    Check Google Cloud service status.
    Called via the unified APIYI (apiyi.com) interface.
    """
    # Google Cloud Status RSS Feed
    status_url = "https://status.cloud.google.com/incidents.json"

    try:
        response = requests.get(status_url, timeout=10)
        incidents = response.json()

        # Filter for Vertex AI-related incidents
        vertex_incidents = [
            inc for inc in incidents
            if 'Vertex AI' in str(inc.get('affected_products', []))
        ]

        return {
            'status': 'healthy' if not vertex_incidents else 'degraded',
            'incidents': vertex_incidents
        }
    except Exception as e:
        return {'status': 'unknown', 'error': str(e)}

# Perform check
result = check_google_cloud_status()
print(f"Vertex AI Status: {result['status']}")
AI Studio Status Monitoring
Google AI Studio provides a dedicated status page specifically for Gemini and Imagen models.
AI Studio Status Page: aistudio.google.com/status
| Monitored Item | Description | Check Frequency |
|---|---|---|
| Gemini Models | Text generation model status | Real-time |
| Imagen Models | Image generation model status | Real-time |
| API Quota | Quota usage details | Hourly |
| Regional Status | Service status by region | Real-time |
View complete AI Studio status monitoring code
import requests
from datetime import datetime, timedelta
import json

class AIStudioMonitor:
    """
    AI Studio status monitoring class.
    Suitable for monitoring Nano Banana Pro (Imagen 3) service status.
    """

    def __init__(self, api_key: str):
        self.api_key = api_key
        # Use the unified APIYI interface
        self.base_url = "https://api.apiyi.com/v1"
        self.status_history = []

    def check_imagen_health(self) -> dict:
        """
        Detect Imagen 3 service health via actual API calls.
        """
        try:
            headers = {
                "Authorization": f"Bearer {self.api_key}",
                "Content-Type": "application/json"
            }

            # Send a lightweight test request
            test_payload = {
                "model": "nano-banana-pro",
                "prompt": "health check test",
                "n": 1,
                "size": "256x256"  # Minimum size to keep costs low
            }

            start_time = datetime.now()
            response = requests.post(
                f"{self.base_url}/images/generations",
                headers=headers,
                json=test_payload,
                timeout=60
            )
            latency = (datetime.now() - start_time).total_seconds()

            if response.status_code == 200:
                return {
                    'status': 'healthy',
                    'latency': latency,
                    'timestamp': datetime.now().isoformat()
                }
            elif response.status_code == 429:
                return {
                    'status': 'rate_limited',
                    'latency': latency,
                    'timestamp': datetime.now().isoformat()
                }
            else:
                return {
                    'status': 'degraded',
                    'error_code': response.status_code,
                    'timestamp': datetime.now().isoformat()
                }

        except requests.Timeout:
            return {
                'status': 'timeout',
                'timestamp': datetime.now().isoformat()
            }
        except Exception as e:
            return {
                'status': 'error',
                'error': str(e),
                'timestamp': datetime.now().isoformat()
            }

    def get_uptime_stats(self, hours: int = 24) -> dict:
        """
        Calculate availability statistics for the past N hours.
        """
        cutoff = datetime.now() - timedelta(hours=hours)
        recent_checks = [
            s for s in self.status_history
            if datetime.fromisoformat(s['timestamp']) > cutoff
        ]

        if not recent_checks:
            return {'uptime': 'N/A', 'sample_count': 0}

        healthy_count = sum(1 for s in recent_checks if s['status'] == 'healthy')
        uptime_pct = (healthy_count / len(recent_checks)) * 100

        return {
            'uptime': f"{uptime_pct:.2f}%",
            'sample_count': len(recent_checks),
            'healthy_count': healthy_count,
            'period_hours': hours
        }

# Usage Example
monitor = AIStudioMonitor(api_key="your-apiyi-key")
health = monitor.check_imagen_health()
print(f"Nano Banana Pro Health Status: {health}")
💡 Recommendation: Choosing a monitoring solution really depends on your specific needs. We recommend performing API call tests via the APIYI (apiyi.com) platform, which provides a built-in status monitoring dashboard for a quick look at service availability.
Nano Banana Pro API Monitoring Method 2: OpenRouter Third-party Monitoring
OpenRouter provides professional third-party AI model monitoring services, which is an important supplement for monitoring the availability of the Nano Banana Pro API.
OpenRouter Uptime Monitoring Page
Nano Banana Pro Monitoring URL: openrouter.ai/google/gemini-3-pro-image-preview/uptime
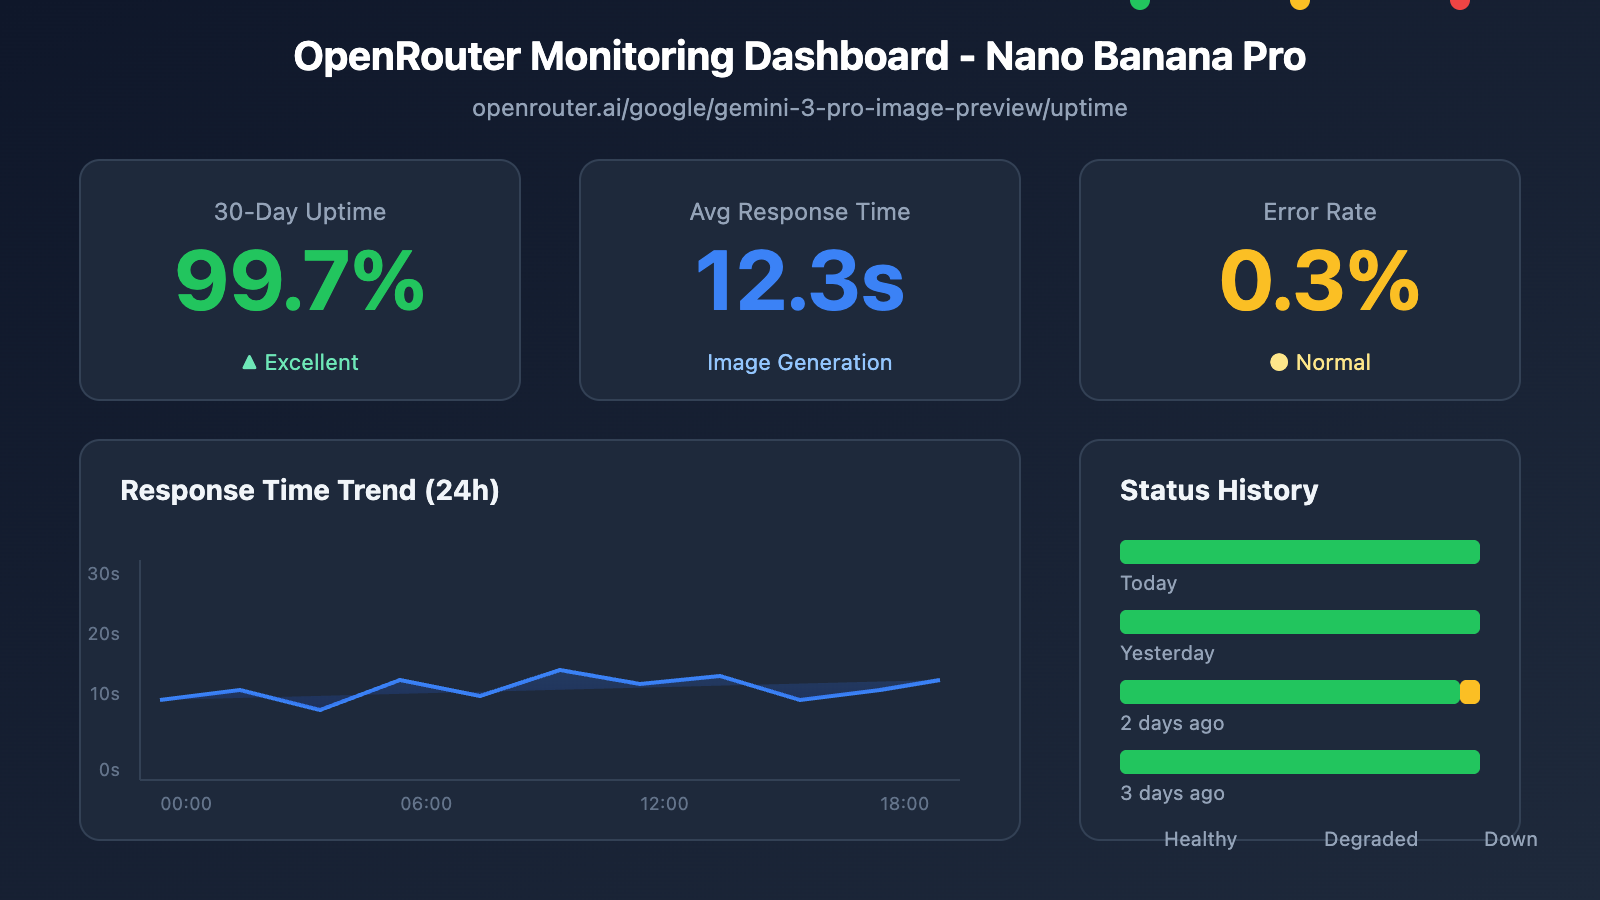
Interpreting OpenRouter Monitoring Data
| Metric | Meaning | Reference Value |
|---|---|---|
| Uptime % | Availability over the past 30 days | ≥ 99% is excellent |
| Avg Latency | Average response delay | 10-20s is normal for image generation |
| P95 Latency | 95th percentile request latency | < 30s is normal |
| Error Rate | Request error rate | < 2% is healthy |
| Throughput | Request throughput | Reflects model popularity |
Monitoring Data Acquisition Script
import requests
from bs4 import BeautifulSoup
import json

def get_openrouter_uptime(model_id: str = "google/gemini-3-pro-image-preview"):
    """
    获取 OpenRouter 模型可用性数据
    适用于 Nano Banana Pro (Imagen 3) 监控
    """
    uptime_url = f"https://openrouter.ai/{model_id}/uptime"

    # 注意: OpenRouter 可能需要 API 调用获取详细数据
    # 这里展示基本的可用性检查思路

    try:
        # 通过 OpenRouter API 获取模型信息
        api_url = "https://openrouter.ai/api/v1/models"
        response = requests.get(api_url, timeout=10)
        models = response.json().get('data', [])

        # 查找目标模型
        target_model = next(
            (m for m in models if m.get('id') == model_id),
            None
        )

        if target_model:
            return {
                'model_id': model_id,
                'status': 'available' if target_model else 'unknown',
                'pricing': target_model.get('pricing', {}),
                'context_length': target_model.get('context_length'),
                'uptime_url': uptime_url
            }
        else:
            return {
                'model_id': model_id,
                'status': 'not_found',
                'uptime_url': uptime_url
            }

    except Exception as e:
        return {
            'model_id': model_id,
            'status': 'error',
            'error': str(e)
        }

# 检查 Nano Banana Pro 状态
nano_status = get_openrouter_uptime()
print(json.dumps(nano_status, indent=2))
Multi-Model Comparison Monitoring
You can use OpenRouter to monitor the status of multiple image generation models at the same time:
| Model | OpenRouter ID | Monitoring Value |
|---|---|---|
| Nano Banana Pro | google/gemini-3-pro-image-preview | Primary monitoring target |
| DALL-E 3 | openai/dall-e-3 | Alternative solution status |
| Stable Diffusion 3 | stabilityai/stable-diffusion-3 | Alternative solution status |
| Midjourney | – | API not yet supported |
🚀 Quick Start: We recommend using the APIYI (apiyi.com) platform to quickly build image generation prototypes. It offers out-of-the-box multi-model switching capabilities, automatically failing over to an alternative model if the primary one becomes unavailable.
Nano Banana Pro API Monitoring Method 3: Active Probing
Besides passively subscribing to status pages, active probing is a critical way to ensure business stability.
Scheduled Probing Script
import openai
import time
import json
from datetime import datetime
import schedule

# Use the APIYI unified interface
client = openai.OpenAI(
    api_key="your-apiyi-key",
    base_url="https://api.apiyi.com/v1"
)

class NanoBananaProMonitor:
    """
    Active probing monitor for Nano Banana Pro API
    """

    def __init__(self):
        self.check_results = []
        self.alert_threshold = 3  # Trigger alert after 3 consecutive failures
        self.consecutive_failures = 0

    def health_check(self) -> dict:
        """
        Perform a health check
        """
        start_time = time.time()

        try:
            response = client.images.generate(
                model="nano-banana-pro",
                prompt="A simple red circle on white background",
                n=1,
                size="256x256"
            )

            latency = time.time() - start_time

            result = {
                'timestamp': datetime.now().isoformat(),
                'status': 'success',
                'latency': round(latency, 2),
                'model': 'nano-banana-pro'
            }

            self.consecutive_failures = 0

        except openai.RateLimitError:
            result = {
                'timestamp': datetime.now().isoformat(),
                'status': 'rate_limited',
                'latency': time.time() - start_time,
                'model': 'nano-banana-pro'
            }
            # Rate limits don't count as failures

        except openai.APIError as e:
            result = {
                'timestamp': datetime.now().isoformat(),
                'status': 'api_error',
                'error': str(e),
                'model': 'nano-banana-pro'
            }
            self.consecutive_failures += 1

        except Exception as e:
            result = {
                'timestamp': datetime.now().isoformat(),
                'status': 'error',
                'error': str(e),
                'model': 'nano-banana-pro'
            }
            self.consecutive_failures += 1

        self.check_results.append(result)

        # Check if an alert is needed
        if self.consecutive_failures >= self.alert_threshold:
            self.send_alert(result)

        return result

    def send_alert(self, result: dict):
        """
        Send alert notification.
        Can integrate with: WeCom, DingTalk, Feishu, Slack, Email, etc.
        """
        alert_message = f"""
        🚨 Nano Banana Pro API Alert

        Status: {result.get('status')}
        Time: {result.get('timestamp')}
        Error: {result.get('error', 'N/A')}
        Consecutive Failures: {self.consecutive_failures}
        """

        print(alert_message)
        # In a real project, connect to your notification channels
        # self.send_wechat(alert_message)
        # self.send_feishu(alert_message)

    def get_statistics(self, hours: int = 24) -> dict:
        """
        Get monitoring statistics
        """
        from datetime import timedelta

        cutoff = datetime.now() - timedelta(hours=hours)
        recent = [
            r for r in self.check_results
            if datetime.fromisoformat(r['timestamp']) > cutoff
        ]

        if not recent:
            return {'message': 'No data available'}

        success_count = sum(1 for r in recent if r['status'] == 'success')
        total_count = len(recent)

        latencies = [r['latency'] for r in recent if 'latency' in r and r['status'] == 'success']
        avg_latency = sum(latencies) / len(latencies) if latencies else 0

        return {
            'period_hours': hours,
            'total_checks': total_count,
            'success_count': success_count,
            'uptime_percentage': round((success_count / total_count) * 100, 2),
            'avg_latency': round(avg_latency, 2),
            'last_check': recent[-1] if recent else None
        }

# Create monitoring instance
monitor = NanoBananaProMonitor()

# Set up scheduled task: check every 5 minutes
schedule.every(5).minutes.do(monitor.health_check)

# Run monitoring (for production use)
# while True:
#     schedule.run_pending()
#     time.sleep(1)

# Example of a single check
result = monitor.health_check()
print(json.dumps(result, indent=2, ensure_ascii=False))
View full monitoring system code (including alert integrations)
import openai
import requests
import time
import json
import schedule
import threading
from datetime import datetime, timedelta
from typing import Optional, List, Dict
from dataclasses import dataclass, asdict
from enum import Enum

class AlertChannel(Enum):
    FEISHU = "feishu"
    WECHAT = "wechat"
    DINGTALK = "dingtalk"
    SLACK = "slack"
    EMAIL = "email"

@dataclass
class CheckResult:
    timestamp: str
    status: str
    latency: Optional[float] = None
    error: Optional[str] = None
    model: str = "nano-banana-pro"

@dataclass
class AlertConfig:
    enabled: bool = True
    channels: List[AlertChannel] = None
    threshold: int = 3
    cooldown_minutes: int = 30
    webhook_urls: Dict[str, str] = None

class EnterpriseMonitor:
    """
    Enterprise-grade Nano Banana Pro API monitoring system.
    Supports multi-channel alerts, data persistence, and monitoring dashboards.
    """

    def __init__(
        self,
        api_key: str,
        base_url: str = "https://api.apiyi.com/v1",
        alert_config: Optional[AlertConfig] = None
    ):
        self.client = openai.OpenAI(
            api_key=api_key,
            base_url=base_url
        )
        self.alert_config = alert_config or AlertConfig()
        self.check_results: List[CheckResult] = []
        self.consecutive_failures = 0
        self.last_alert_time: Optional[datetime] = None
        self._lock = threading.Lock()

    def health_check(self) -> CheckResult:
        """
        Perform a health check
        """
        start_time = time.time()

        try:
            response = self.client.images.generate(
                model="nano-banana-pro",
                prompt="health check: simple geometric shape",
                n=1,
                size="256x256"
            )

            latency = time.time() - start_time
            result = CheckResult(
                timestamp=datetime.now().isoformat(),
                status="success",
                latency=round(latency, 2)
            )

            with self._lock:
                self.consecutive_failures = 0

        except openai.RateLimitError:
            result = CheckResult(
                timestamp=datetime.now().isoformat(),
                status="rate_limited",
                latency=round(time.time() - start_time, 2)
            )

        except openai.APIError as e:
            result = CheckResult(
                timestamp=datetime.now().isoformat(),
                status="api_error",
                error=str(e)
            )
            with self._lock:
                self.consecutive_failures += 1

        except Exception as e:
            result = CheckResult(
                timestamp=datetime.now().isoformat(),
                status="error",
                error=str(e)
            )
            with self._lock:
                self.consecutive_failures += 1

        with self._lock:
            self.check_results.append(result)

            # Keep the last 1,000 records
            if len(self.check_results) > 1000:
                self.check_results = self.check_results[-1000:]

        # Check alert conditions
        self._check_alert(result)

        return result

    def _check_alert(self, result: CheckResult):
        """
        Check if an alert needs to be sent
        """
        if not self.alert_config.enabled:
            return

        if self.consecutive_failures < self.alert_config.threshold:
            return

        # Check alert cooldown
        if self.last_alert_time:
            cooldown = timedelta(minutes=self.alert_config.cooldown_minutes)
            if datetime.now() - self.last_alert_time < cooldown:
                return

        self._send_alerts(result)
        self.last_alert_time = datetime.now()

    def _send_alerts(self, result: CheckResult):
        """
        Send multi-channel alerts
        """
        message = self._format_alert_message(result)

        if not self.alert_config.webhook_urls:
            print(f"[ALERT] {message}")
            return

        for channel, webhook_url in self.alert_config.webhook_urls.items():
            try:
                if channel == "feishu":
                    self._send_feishu_alert(webhook_url, message)
                elif channel == "wechat":
                    self._send_wechat_alert(webhook_url, message)
                elif channel == "dingtalk":
                    self._send_dingtalk_alert(webhook_url, message)
                elif channel == "slack":
                    self._send_slack_alert(webhook_url, message)
            except Exception as e:
                print(f"Failed to send {channel} alert: {e}")

    def _format_alert_message(self, result: CheckResult) -> str:
        """
        Format alert message
        """
        return f"""
🚨 Nano Banana Pro API Exception Alert

📊 Status Details:
• Status: {result.status}
• Time: {result.timestamp}
• Error: {result.error or 'N/A'}
• Consecutive Failures: {self.consecutive_failures}

🔗 Monitoring Sources:
• Google Cloud Status: status.cloud.google.com
• OpenRouter Uptime: openrouter.ai/google/gemini-3-pro-image-preview/uptime
• APIYI Monitoring: apiyi.com

⚡ Recommended Actions:
1. Check the Google Cloud status page
2. Verify if the API key is valid
3. Check network connection status
4. Contact APIYI technical support
        """.strip()

    def _send_feishu_alert(self, webhook_url: str, message: str):
        """Feishu bot alert"""
        payload = {
            "msg_type": "text",
            "content": {"text": message}
        }
        requests.post(webhook_url, json=payload, timeout=10)

    def _send_wechat_alert(self, webhook_url: str, message: str):
        """WeCom bot alert"""
        payload = {
            "msgtype": "text",
            "text": {"content": message}
        }
        requests.post(webhook_url, json=payload, timeout=10)

    def _send_dingtalk_alert(self, webhook_url: str, message: str):
        """DingTalk bot alert"""
        payload = {
            "msgtype": "text",
            "text": {"content": message}
        }
        requests.post(webhook_url, json=payload, timeout=10)

    def _send_slack_alert(self, webhook_url: str, message: str):
        """Slack bot alert"""
        payload = {"text": message}
        requests.post(webhook_url, json=payload, timeout=10)

    def get_dashboard_data(self) -> dict:
        """
        Get monitoring dashboard data
        """
        now = datetime.now()

        # Calculate statistics for different time periods
        periods = {
            '1h': timedelta(hours=1),
            '6h': timedelta(hours=6),
            '24h': timedelta(hours=24),
            '7d': timedelta(days=7)
        }

        stats = {}
        for period_name, delta in periods.items():
            cutoff = now - delta
            recent = [
                r for r in self.check_results
                if datetime.fromisoformat(r.timestamp) > cutoff
            ]

            if recent:
                success = sum(1 for r in recent if r.status == 'success')
                latencies = [r.latency for r in recent if r.latency]

                stats[period_name] = {
                    'total': len(recent),
                    'success': success,
                    'uptime': round((success / len(recent)) * 100, 2),
                    'avg_latency': round(sum(latencies) / len(latencies), 2) if latencies else None
                }
            else:
                stats[period_name] = None

        return {
            'model': 'nano-banana-pro',
            'current_status': self.check_results[-1].status if self.check_results else 'unknown',
            'consecutive_failures': self.consecutive_failures,
            'statistics': stats,
            'last_update': now.isoformat()
        }

# Usage example
if __name__ == "__main__":
    # Configure alerts
    alert_config = AlertConfig(
        enabled=True,
        threshold=3,
        cooldown_minutes=30,
        webhook_urls={
            "feishu": "https://open.feishu.cn/open-apis/bot/v2/hook/xxx",
            # "wechat": "https://qyapi.weixin.qq.com/cgi-bin/webhook/send?key=xxx",
        }
    )

    # Create monitoring instance
    monitor = EnterpriseMonitor(
        api_key="your-apiyi-key",
        base_url="https://api.apiyi.com/v1",
        alert_config=alert_config
    )

    # Perform check
    result = monitor.health_check()
    print("Check Result:", asdict(result))

    # Get dashboard data
    dashboard = monitor.get_dashboard_data()
    print("Dashboard Data:", json.dumps(dashboard, indent=2, ensure_ascii=False))
Nano Banana Pro API Monitoring & Alert Configuration
Alert Channel Integration
| Channel | Webhook Format | Use Case |
|---|---|---|
| Feishu | open.feishu.cn/open-apis/bot/v2/hook/xxx | Top choice for domestic teams (China) |
| WeCom | qyapi.weixin.qq.com/cgi-bin/webhook/send | Users within the WeChat ecosystem |
| DingTalk | oapi.dingtalk.com/robot/send | Alibaba-affiliated enterprises |
| Slack | hooks.slack.com/services/xxx | Global/International teams |
| SMTP Configuration | Formal records and logging |
Defining Alert Levels
# Alert level configuration
ALERT_LEVELS = {
    'info': {
        'triggers': ['rate_limited'],
        'channels': ['log'],
        'color': '#36a64f'
    },
    'warning': {
        'triggers': ['timeout', 'degraded'],
        'channels': ['feishu', 'slack'],
        'color': '#ff9800'
    },
    'critical': {
        'triggers': ['api_error', 'error'],
        'channels': ['feishu', 'wechat', 'slack', 'email'],
        'color': '#f44336'
    }
}
💰 Cost Optimization: For budget-conscious projects, consider routing your Nano Banana Pro API calls through the APIYI (apiyi.com) platform. They offer flexible billing and built-in monitoring tools, which can significantly lower the overhead of building your own monitoring stack.
Nano Banana Pro API Monitoring Best Practices
Monitoring Strategy Mix
Choose the right monitoring mix based on how critical the service is to your business:
| Business Level | Official Status Page | Third-party Monitoring | Active Probing | Alert Channels |
|---|---|---|---|---|
| Core | ✅ Subscribe | ✅ OpenRouter | ✅ 1-minute interval | Multi-channel |
| High Priority | ✅ Subscribe | ✅ OpenRouter | ✅ 5-minute interval | Feishu + Email |
| Standard | ✅ Subscribe | Optional | ✅ 15-minute interval | Feishu |
| Dev/Staging | Optional | – | ✅ 30-minute interval | Logs |
Incident Response Workflow
Anomaly Detected
    ↓
Assess Impact Range (Prod vs. Test)
    ↓
Check Official Status Page
    ↓
├── Official Outage Confirmed → Wait for recovery + Notify users
├── Official Status OK → Check local configuration
│   ├── API Key validity
│   ├── Quota usage
│   ├── Network connectivity
│   └── Request parameter compliance
└── Inconclusive → Contact tech support
Analyzing Monitoring Data
import pandas as pd
from datetime import datetime, timedelta

def analyze_monitoring_data(check_results: list) -> dict:
    """
    Analyze monitoring data and generate a report
    """
    df = pd.DataFrame(check_results)
    df['timestamp'] = pd.to_datetime(df['timestamp'])

    # Hourly statistics
    df['hour'] = df['timestamp'].dt.floor('H')
    hourly_stats = df.groupby('hour').agg({
        'status': lambda x: (x == 'success').mean() * 100,
        'latency': 'mean'
    }).rename(columns={
        'status': 'uptime_pct',
        'latency': 'avg_latency'
    })

    # Identify anomaly periods
    anomalies = hourly_stats[hourly_stats['uptime_pct'] < 99]

    # Latency trends
    df['date'] = df['timestamp'].dt.date
    daily_latency = df.groupby('date')['latency'].mean()

    return {
        'hourly_stats': hourly_stats.to_dict(),
        'anomaly_periods': anomalies.index.tolist(),
        'daily_latency_trend': daily_latency.to_dict(),
        'overall_uptime': df[df['status'] == 'success'].shape[0] / len(df) * 100
    }
FAQ
Q1: What’s the ideal monitoring frequency for the Nano Banana Pro API?
The right frequency depends on how critical the service is to your business:
- Core Production Environments: We recommend checking every 1-2 minutes.
- Important Business Logic: Once every 5 minutes is usually enough.
- General Internal Tasks: Every 10-15 minutes should suffice.
You can grab some free test credits on the APIYI (apiyi.com) platform to quickly validate your monitoring setup. Just remember to find the right balance between monitoring costs and response speed.
Q2: How do I tell the difference between temporary fluctuations and a real outage?
It's best to use a combination of these strategies:
- Consecutive Failure Threshold: Only trigger an alert after 3 or more consecutive failures.
- Sliding Window: Define an outage only if the failure rate exceeds 50% within a 5-minute window.
- Multi-source Verification: Check the official status page at the same time to see if it's a global issue.
- Exclude Rate Limits: Remember, hitting a rate limit isn't the same as a system failure.
With the monitoring dashboard on the APIYI (apiyi.com) platform, you can visually track historical availability trends to quickly determine if you're dealing with a systemic issue.
Q3: Is the third-party monitoring data from OpenRouter reliable?
As a well-known AI model aggregator, OpenRouter's monitoring data is a great reference point:
- Pros: It aggregates request data from users worldwide, providing a massive sample size.
- Limitations: The data might include latency or issues stemming from OpenRouter's own infrastructure.
- Advice: Use it as a secondary data point alongside official status pages and your own custom monitoring.
Q4: What should I do if I’m suffering from “alert fatigue”?
Alert fatigue is a common headache. Here’s how to manage it:
- Set Alert Severity: Differentiate between Info, Warning, and Critical levels.
- Configure Cooling-off Periods: Ensure the same issue only triggers one alert every 30 minutes.
- Aggregate Alerts: Group similar issues into a single notification.
- Alert Suppression: Temporarily disable alerts during scheduled maintenance.
- Continuous Optimization: Regularly review false positives and adjust your thresholds accordingly.
Summary
Monitoring the availability of the Nano Banana Pro API is essential for keeping your image generation business stable. In this guide, we've covered three practical monitoring methods:
- Official Google Status Pages: Keep an eye on Cloud Status and AI Studio Status for firsthand official info.
- OpenRouter Third-party Monitoring: Use openrouter.ai’s Uptime page for community-driven availability data.
- Active Probing: Implement end-to-end validation through scheduled API calls.
We recommend using APIYI (apiyi.com) to quickly test your monitoring workflows. The platform provides a unified API interface and built-in monitoring dashboards, helping developers significantly cut down on maintenance overhead.
Author: APIYI Technical Team
Tech Exchange: Visit APIYI (apiyi.com) for more AI API tips and best practices.
Updated: 2026-01-28
Related Resources
| Resource Type | Description |
|---|---|
| Google Cloud Status | status.cloud.google.com |
| AI Studio Status | aistudio.google.com/status |
| OpenRouter Uptime | openrouter.ai/google/gemini-3-pro-image-preview/uptime |
| APIYI Official Website | apiyi.com |