Nano Banana Pro APIの可用性を監視することは、開発者が画像生成ビジネスを安定して運用するために不可欠な要件です。本記事では、サービスのステータスをリアルタイムで把握し、障害に迅速に対応するための、3つの実用的なNano Banana Pro API監視方法をご紹介します。
コアバリュー: 本記事を読み終えることで、Google公式のステータスページやOpenRouterなどのサードパーティ製監視ツールを活用し、Nano Banana Pro APIの包括的な可用性監視体系を構築できるようになります。
Nano Banana Pro API 監視の要点
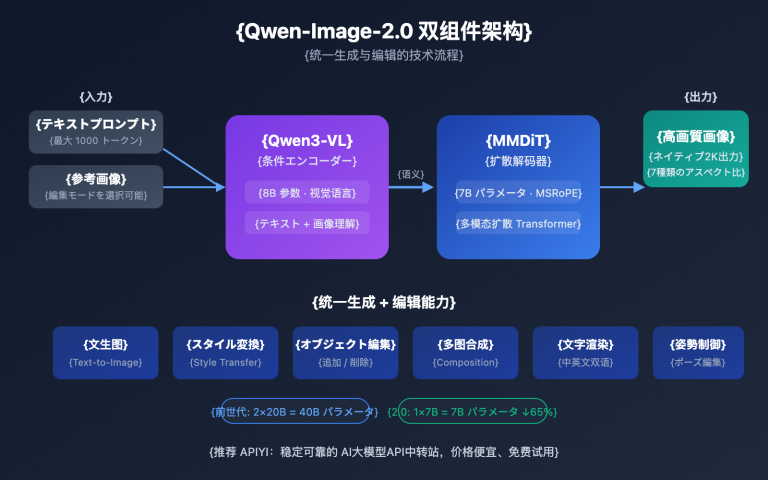
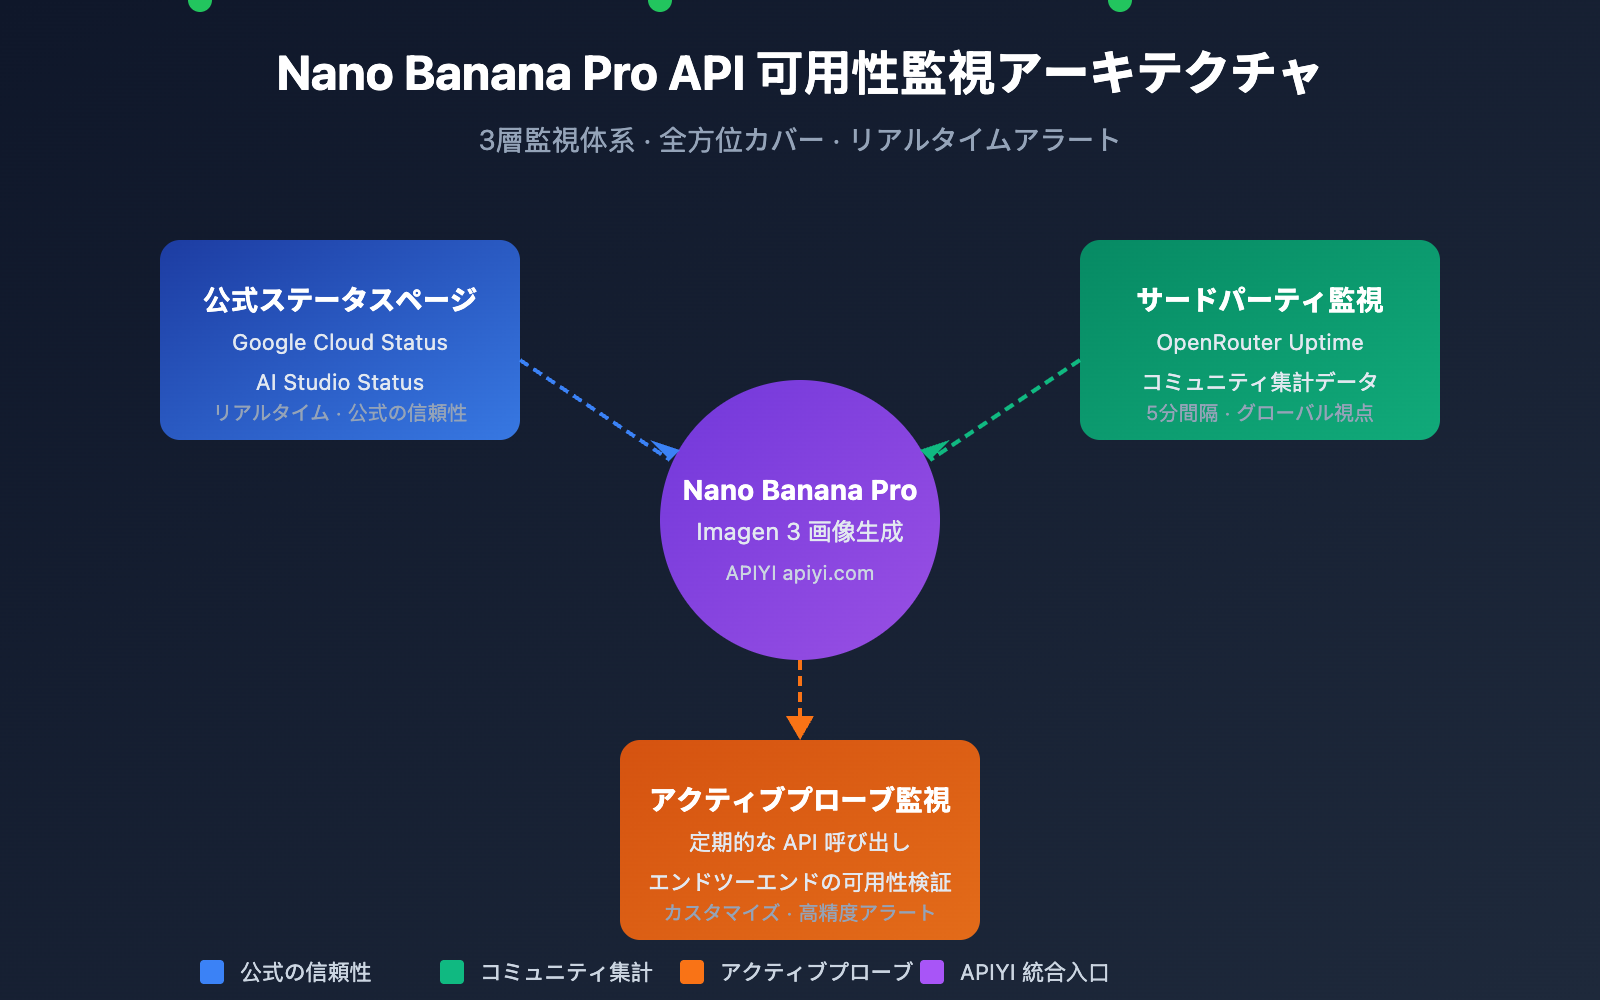
Nano Banana Pro(Google Imagen 3ベース)は、現在最も強力なAI画像生成モデルの一つです。その基盤はGoogle Cloudインフラに依存しているため、監視戦略は複数のレイヤーをカバーする必要があります。
| 監視レイヤー | 監視ソース | 監視内容 | 更新頻度 |
|---|---|---|---|
| インフラ層 | Google Cloud Status | コンピューティング、ネットワーク、ストレージサービス | リアルタイム |
| AIサービス層 | AI Studio Status | Gemini、Imagen モデルサービス | リアルタイム |
| サードパーティ集計 | OpenRouter Uptime | API応答率、レイテンシ統計 | 5分 |
| アクティブプローブ | 独自構築の監視スクリプト | エンドツーエンドの可用性テスト | カスタマイズ |
Nano Banana Pro API 監視の主要メトリクス
Nano Banana Pro APIを監視する際は、以下のコアメトリクスに注目する必要があります。
| メトリクス名 | 正常範囲 | アラートしきい値 | 説明 |
|---|---|---|---|
| API可用率 | ≥ 99.5% | < 99% | サービス全体の可用性 |
| 応答レイテンシ | 5-15 秒 | > 30 秒 | 画像生成の所要時間 |
| エラー率 | < 1% | > 5% | リクエスト失敗の割合 |
| レート制限の発生 | 0回/時 | > 10回/時 | Rate Limitへの到達 |
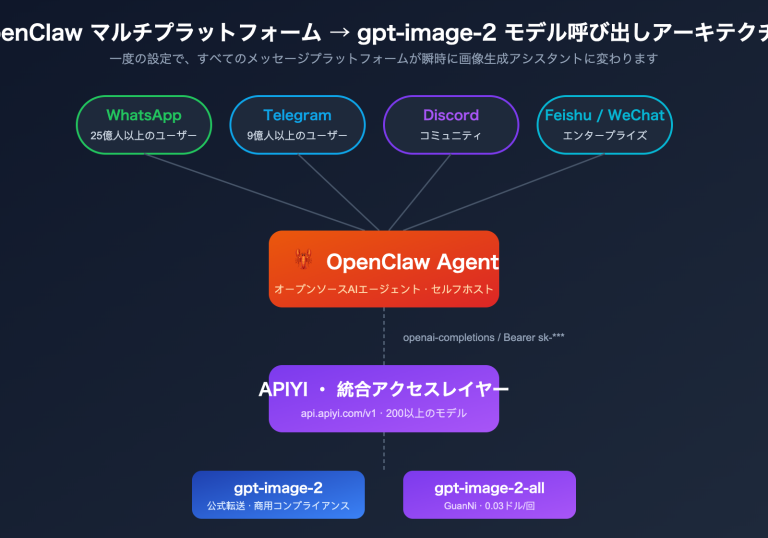
🎯 テクニカルアドバイス: 実際の開発では、APIYI プラットフォーム経由で Nano Banana Pro API を呼び出すことをお勧めします。同プラットフォームは統合されたステータス監視とアラートサービスを提供しており、独自の監視システムを構築するコストを削減できます。
Nano Banana Pro API 監視方法1:Google 公式ステータスページ
Google Cloud Status 監視
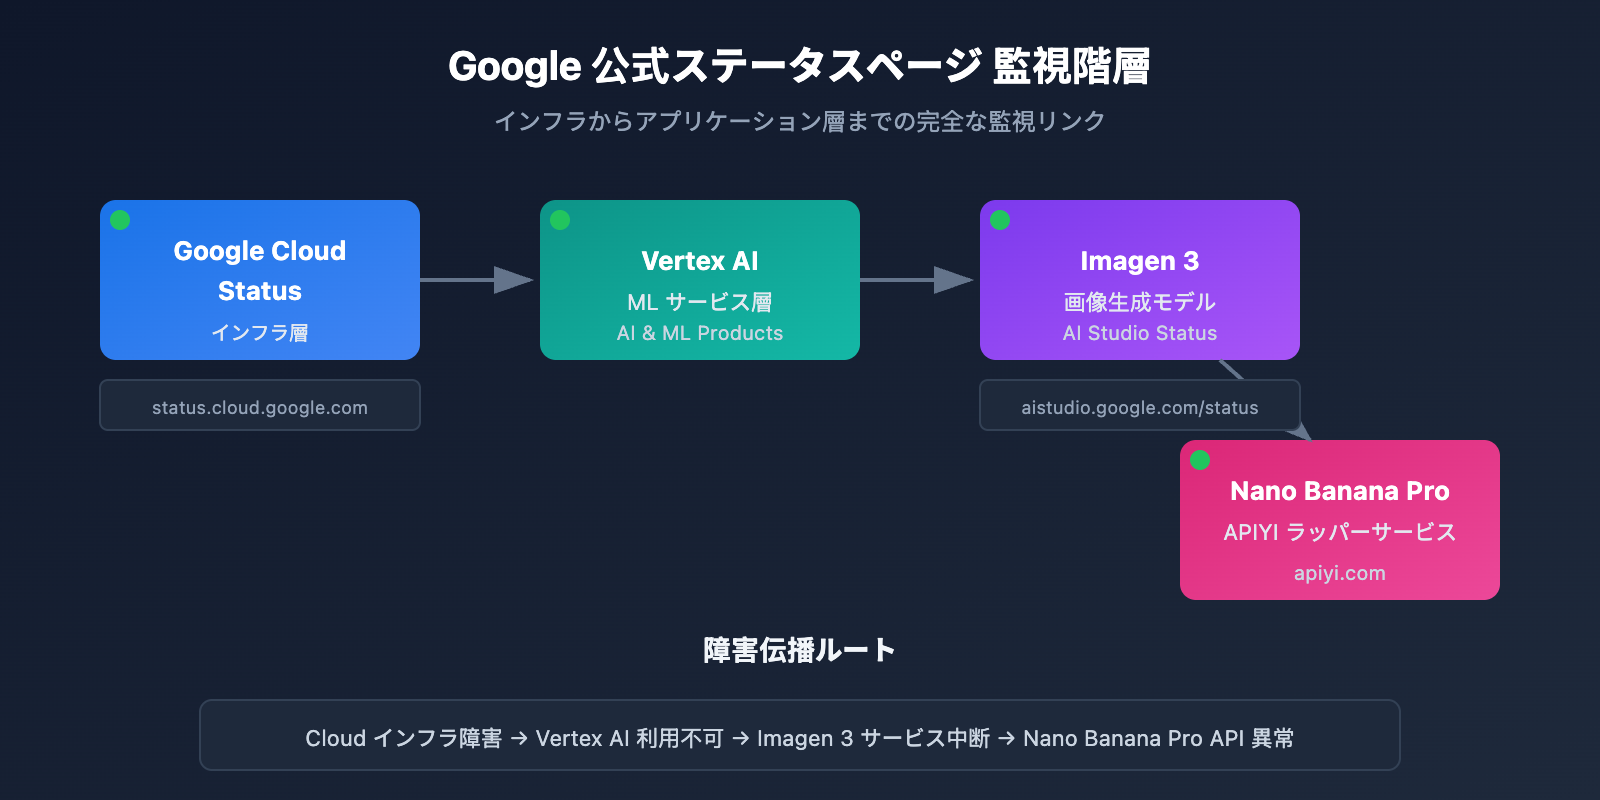
Google Cloud Status ページは、Google インフラストラクチャのリアルタイムなステータス情報を提供しており、Nano Banana Pro の基盤となるサービスを監視するための最適な情報源です。
公式ステータスページ URL: status.cloud.google.com
主要な監視サービス
| サービス名 | ステータスページの場所 | 影響範囲 |
|---|---|---|
| Vertex AI | AI & Machine Learning | Imagen 3 に直接影響 |
| Cloud Storage | Storage | 画像の保存と返却に影響 |
| Cloud Run | Compute | API ゲートウェイサービスに影響 |
| Cloud Load Balancing | Networking | リクエストルーティングに影響 |
ステータス購読の設定
Google Cloud Status は、さまざまな購読(サブスクリプション)方法をサポートしています。
# 例: Google Cloud Status API を使用してステータスを取得
import requests

def check_google_cloud_status():
    """
    Google Cloud サービスのステータスを確認
    APIYI apiyi.com の統合インターフェース経由で呼び出します
    """
    # Google Cloud Status RSS Feed
    status_url = "https://status.cloud.google.com/incidents.json"

    try:
        response = requests.get(status_url, timeout=10)
        incidents = response.json()

        # Vertex AI 関連のインシデントをフィルタリング
        vertex_incidents = [
            inc for inc in incidents
            if 'Vertex AI' in str(inc.get('affected_products', []))
        ]

        return {
            'status': 'healthy' if not vertex_incidents else 'degraded',
            'incidents': vertex_incidents
        }
    except Exception as e:
        return {'status': 'unknown', 'error': str(e)}

# チェックの実行
result = check_google_cloud_status()
print(f"Vertex AI ステータス: {result['status']}")
AI Studio Status 監視
Google AI Studio は、Gemini および Imagen モデル専用のステータスページを提供しています。
AI Studio ステータスページ URL: aistudio.google.com/status
| 監視項目 | 説明 | チェック頻度 |
|---|---|---|
| Gemini Models | テキスト生成モデルのステータス | リアルタイム |
| Imagen Models | 画像生成モデルのステータス | リアルタイム |
| API Quota | 割り当て(クォータ)の使用状況 | 1時間ごと |
| Regional Status | リージョンごとのサービスステータス | リアルタイム |
AI Studio ステータス監視の完全なコードを表示
import requests
from datetime import datetime, timedelta
import json

class AIStudioMonitor:
    """
    AI Studio 監視クラス
    Nano Banana Pro (Imagen 3) のサービスステータス監視に適しています
    """

    def __init__(self, api_key: str):
        self.api_key = api_key
        # APIYI の統合インターフェースを使用
        self.base_url = "https://api.apiyi.com/v1"
        self.status_history = []

    def check_imagen_health(self) -> dict:
        """
        実際の API 呼び出しを通じて Imagen 3 サービスの健全性を検出します
        """
        try:
            headers = {
                "Authorization": f"Bearer {self.api_key}",
                "Content-Type": "application/json"
            }

            # 軽量なテストリクエストを送信
            test_payload = {
                "model": "nano-banana-pro",
                "prompt": "health check test",
                "n": 1,
                "size": "256x256"  # コスト削減のため最小サイズ
            }

            start_time = datetime.now()
            response = requests.post(
                f"{self.base_url}/images/generations",
                headers=headers,
                json=test_payload,
                timeout=60
            )
            latency = (datetime.now() - start_time).total_seconds()

            if response.status_code == 200:
                return {
                    'status': 'healthy',
                    'latency': latency,
                    'timestamp': datetime.now().isoformat()
                }
            elif response.status_code == 429:
                return {
                    'status': 'rate_limited',
                    'latency': latency,
                    'timestamp': datetime.now().isoformat()
                }
            else:
                return {
                    'status': 'degraded',
                    'error_code': response.status_code,
                    'timestamp': datetime.now().isoformat()
                }

        except requests.Timeout:
            return {
                'status': 'timeout',
                'timestamp': datetime.now().isoformat()
            }
        except Exception as e:
            return {
                'status': 'error',
                'error': str(e),
                'timestamp': datetime.now().isoformat()
            }

    def get_uptime_stats(self, hours: int = 24) -> dict:
        """
        過去 N 時間の稼働率統計を計算します
        """
        cutoff = datetime.now() - timedelta(hours=hours)
        recent_checks = [
            s for s in self.status_history
            if datetime.fromisoformat(s['timestamp']) > cutoff
        ]

        if not recent_checks:
            return {'uptime': 'N/A', 'sample_count': 0}

        healthy_count = sum(1 for s in recent_checks if s['status'] == 'healthy')
        uptime_pct = (healthy_count / len(recent_checks)) * 100

        return {
            'uptime': f"{uptime_pct:.2f}%",
            'sample_count': len(recent_checks),
            'healthy_count': healthy_count,
            'period_hours': hours
        }

# 使用例
monitor = AIStudioMonitor(api_key="your-apiyi-key")
health = monitor.check_imagen_health()
print(f"Nano Banana Pro ヘルスステータス: {health}")
💡 推奨事項: どの監視プランを選択するかは、具体的なニーズによって異なります。APIYI apiyi.com プラットフォーム経由での API 呼び出しテストをお勧めします。このプラットフォームには、サービスの可用性を素早く確認できる組み込みのステータス監視パネルが用意されています。
Nano Banana Pro API 監視方法 2:OpenRouter によるサードパーティ監視
OpenRouter は専門的なサードパーティ AI モデル監視サービスを提供しており、Nano Banana Pro API の可用性を監視する上で重要な補完となります。
OpenRouter Uptime 監視ページ
Nano Banana Pro 監視アドレス: openrouter.ai/google/gemini-3-pro-image-preview/uptime
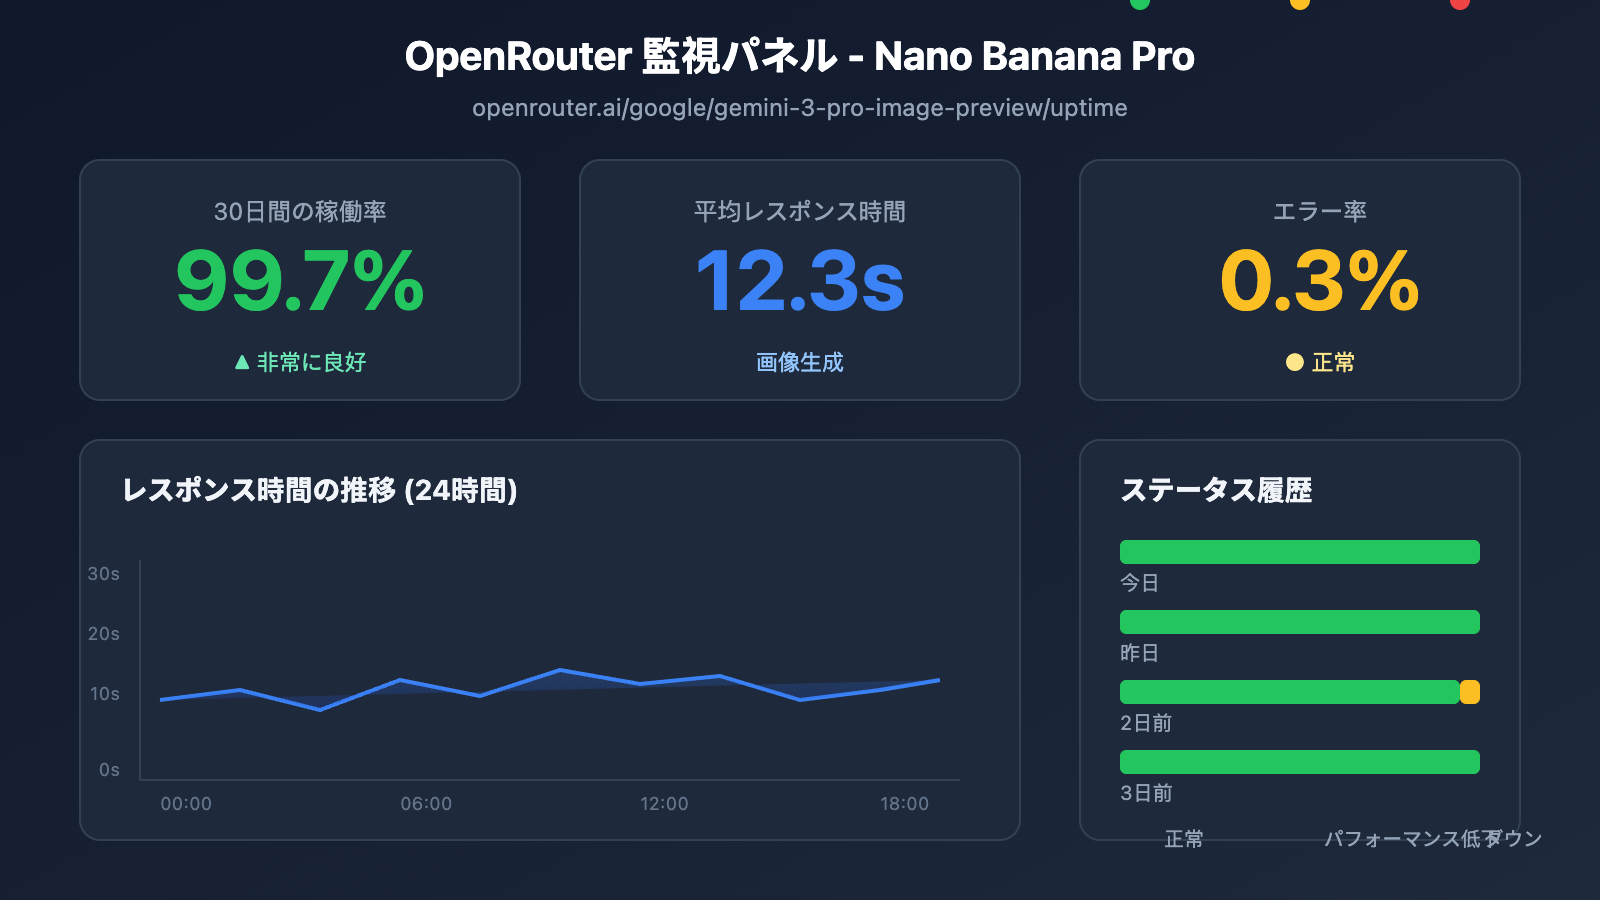
OpenRouter 監視データの読み方
| データ指標 | 意味 | 参考値 |
|---|---|---|
| Uptime % | 過去 30 日間の可用性 | 99% 以上で優秀 |
| Avg Latency | 平均レスポンス遅延 | 画像生成で 10-20秒なら正常 |
| P95 Latency | 95% のリクエストにおける遅延 | 30秒未満で正常 |
| Error Rate | リクエストエラー率 | 2% 未満で健全 |
| Throughput | リクエストスループット | モデルの人気度を反映 |
監視データ取得スクリプト
import requests
from bs4 import BeautifulSoup
import json

def get_openrouter_uptime(model_id: str = "google/gemini-3-pro-image-preview"):
    """
    OpenRouter のモデル可用性データを取得
    Nano Banana Pro (Imagen 3) の監視に適しています
    """
    uptime_url = f"https://openrouter.ai/{model_id}/uptime"

    # 注意: OpenRouter で詳細なデータを取得するには API 呼び出しが必要な場合があります
    # ここでは基本的な可用性チェックの考え方を示します

    try:
        # OpenRouter API を通じてモデル情報を取得
        api_url = "https://openrouter.ai/api/v1/models"
        response = requests.get(api_url, timeout=10)
        models = response.json().get('data', [])

        # 対象モデルを検索
        target_model = next(
            (m for m in models if m.get('id') == model_id),
            None
        )

        if target_model:
            return {
                'model_id': model_id,
                'status': 'available' if target_model else 'unknown',
                'pricing': target_model.get('pricing', {}),
                'context_length': target_model.get('context_length'),
                'uptime_url': uptime_url
            }
        else:
            return {
                'model_id': model_id,
                'status': 'not_found',
                'uptime_url': uptime_url
            }

    except Exception as e:
        return {
            'model_id': model_id,
            'status': 'error',
            'error': str(e)
        }

# Nano Banana Pro のステータスを確認
nano_status = get_openrouter_uptime()
print(json.dumps(nano_status, indent=2))
複数モデルの比較監視
OpenRouter を使用すると、複数の画像生成モデルのステータスを同時に監視できます。
| モデル | OpenRouter ID | 監視の意義 |
|---|---|---|
| Nano Banana Pro | google/gemini-3-pro-image-preview | 主要な監視対象 |
| DALL-E 3 | openai/dall-e-3 | 代替案のステータス |
| Stable Diffusion 3 | stabilityai/stable-diffusion-3 | 代替案のステータス |
| Midjourney | – | 現時点では API 未対応 |
🚀 クイックスタート: 画像生成のプロトタイプを素早く構築するには、APIYI (apiyi.com) プラットフォームの使用をお勧めします。このプラットフォームは、設定不要で利用できるマルチモデル切り替え機能を備えており、メインモデルが利用できない場合に自動的に代替モデルへ切り替えることができます。
Nano Banana Pro API 監視方法 3:アクティブプローブ監視
ステータスページのパッシブな購読に加えて、アクティブプローブ(能動的な監視)はビジネスの安定性を確保するための重要な手段です。
定期実行プローブスクリプト
import openai
import time
import json
from datetime import datetime
import schedule

# APIYI の統合インターフェースを使用
client = openai.OpenAI(
    api_key="your-apiyi-key",
    base_url="https://api.apiyi.com/v1"
)

class NanoBananaProMonitor:
    """
    Nano Banana Pro API アクティブプローブ監視
    """

    def __init__(self):
        self.check_results = []
        self.alert_threshold = 3  # 3回連続失敗でアラートをトリガー
        self.consecutive_failures = 0

    def health_check(self) -> dict:
        """
        ヘルスチェックを1回実行
        """
        start_time = time.time()

        try:
            response = client.images.generate(
                model="nano-banana-pro",
                prompt="A simple red circle on white background",
                n=1,
                size="256x256"
            )

            latency = time.time() - start_time

            result = {
                'timestamp': datetime.now().isoformat(),
                'status': 'success',
                'latency': round(latency, 2),
                'model': 'nano-banana-pro'
            }

            self.consecutive_failures = 0

        except openai.RateLimitError:
            result = {
                'timestamp': datetime.now().isoformat(),
                'status': 'rate_limited',
                'latency': time.time() - start_time,
                'model': 'nano-banana-pro'
            }
            # レート制限(Rate limit)は失敗としてカウントしない

        except openai.APIError as e:
            result = {
                'timestamp': datetime.now().isoformat(),
                'status': 'api_error',
                'error': str(e),
                'model': 'nano-banana-pro'
            }
            self.consecutive_failures += 1

        except Exception as e:
            result = {
                'timestamp': datetime.now().isoformat(),
                'status': 'error',
                'error': str(e),
                'model': 'nano-banana-pro'
            }
            self.consecutive_failures += 1

        self.check_results.append(result)

        # アラートが必要かどうかを確認
        if self.consecutive_failures >= self.alert_threshold:
            self.send_alert(result)

        return result

    def send_alert(self, result: dict):
        """
        アラート通知を送信
        連携可能先:WeCom(企業微信)、DingTalk(釘釘)、Lark(飛書)、Slack、メールなど
        """
        alert_message = f"""
        🚨 Nano Banana Pro API アラート

        ステータス: {result.get('status')}
        時刻: {result.get('timestamp')}
        エラー: {result.get('error', 'N/A')}
        連続失敗: {self.consecutive_failures} 回
        """

        print(alert_message)
        # 実際のプロジェクトでは通知チャネルを連携させる
        # self.send_wechat(alert_message)
        # self.send_feishu(alert_message)

    def get_statistics(self, hours: int = 24) -> dict:
        """
        監視統計データの取得
        """
        from datetime import timedelta

        cutoff = datetime.now() - timedelta(hours=hours)
        recent = [
            r for r in self.check_results
            if datetime.fromisoformat(r['timestamp']) > cutoff
        ]

        if not recent:
            return {'message': 'No data available'}

        success_count = sum(1 for r in recent if r['status'] == 'success')
        total_count = len(recent)

        latencies = [r['latency'] for r in recent if 'latency' in r and r['status'] == 'success']
        avg_latency = sum(latencies) / len(latencies) if latencies else 0

        return {
            'period_hours': hours,
            'total_checks': total_count,
            'success_count': success_count,
            'uptime_percentage': round((success_count / total_count) * 100, 2),
            'avg_latency': round(avg_latency, 2),
            'last_check': recent[-1] if recent else None
        }

# 監視インスタンスを作成
monitor = NanoBananaProMonitor()

# スケジュール設定:5分ごとに1回チェック
schedule.every(5).minutes.do(monitor.health_check)

# 監視を実行(本番環境での使用例)
# while True:
#     schedule.run_pending()
#     time.sleep(1)

# 単発チェックの例
result = monitor.health_check()
print(json.dumps(result, indent=2, ensure_ascii=False))
監視システムの全コード(アラート連携を含む)を表示
import openai
import requests
import time
import json
import schedule
import threading
from datetime import datetime, timedelta
from typing import Optional, List, Dict
from dataclasses import dataclass, asdict
from enum import Enum

class AlertChannel(Enum):
    FEISHU = "feishu"
    WECHAT = "wechat"
    DINGTALK = "dingtalk"
    SLACK = "slack"
    EMAIL = "email"

@dataclass
class CheckResult:
    timestamp: str
    status: str
    latency: Optional[float] = None
    error: Optional[str] = None
    model: str = "nano-banana-pro"

@dataclass
class AlertConfig:
    enabled: bool = True
    channels: List[AlertChannel] = None
    threshold: int = 3
    cooldown_minutes: int = 30
    webhook_urls: Dict[str, str] = None

class EnterpriseMonitor:
    """
    エンタープライズ級 Nano Banana Pro API 監視システム
    マルチチャネルアラート、データの永続化、監視ダッシュボードをサポート
    """

    def __init__(
        self,
        api_key: str,
        base_url: str = "https://api.apiyi.com/v1",
        alert_config: Optional[AlertConfig] = None
    ):
        self.client = openai.OpenAI(
            api_key=api_key,
            base_url=base_url
        )
        self.alert_config = alert_config or AlertConfig()
        self.check_results: List[CheckResult] = []
        self.consecutive_failures = 0
        self.last_alert_time: Optional[datetime] = None
        self._lock = threading.Lock()

    def health_check(self) -> CheckResult:
        """
        ヘルスチェックを実行
        """
        start_time = time.time()

        try:
            response = self.client.images.generate(
                model="nano-banana-pro",
                prompt="health check: simple geometric shape",
                n=1,
                size="256x256"
            )

            latency = time.time() - start_time
            result = CheckResult(
                timestamp=datetime.now().isoformat(),
                status="success",
                latency=round(latency, 2)
            )

            with self._lock:
                self.consecutive_failures = 0

        except openai.RateLimitError:
            result = CheckResult(
                timestamp=datetime.now().isoformat(),
                status="rate_limited",
                latency=round(time.time() - start_time, 2)
            )

        except openai.APIError as e:
            result = CheckResult(
                timestamp=datetime.now().isoformat(),
                status="api_error",
                error=str(e)
            )
            with self._lock:
                self.consecutive_failures += 1

        except Exception as e:
            result = CheckResult(
                timestamp=datetime.now().isoformat(),
                status="error",
                error=str(e)
            )
            with self._lock:
                self.consecutive_failures += 1

        with self._lock:
            self.check_results.append(result)

            # 直近 1000 件のレコードを保持
            if len(self.check_results) > 1000:
                self.check_results = self.check_results[-1000:]

        # アラート条件の確認
        self._check_alert(result)

        return result

    def _check_alert(self, result: CheckResult):
        """
        アラート送信が必要か確認
        """
        if not self.alert_config.enabled:
            return

        if self.consecutive_failures < self.alert_config.threshold:
            return

        # アラートのクールダウン(抑制期間)を確認
        if self.last_alert_time:
            cooldown = timedelta(minutes=self.alert_config.cooldown_minutes)
            if datetime.now() - self.last_alert_time < cooldown:
                return

        self._send_alerts(result)
        self.last_alert_time = datetime.now()

    def _send_alerts(self, result: CheckResult):
        """
        マルチチャネルでアラートを送信
        """
        message = self._format_alert_message(result)

        if not self.alert_config.webhook_urls:
            print(f"[ALERT] {message}")
            return

        for channel, webhook_url in self.alert_config.webhook_urls.items():
            try:
                if channel == "feishu":
                    self._send_feishu_alert(webhook_url, message)
                elif channel == "wechat":
                    self._send_wechat_alert(webhook_url, message)
                elif channel == "dingtalk":
                    self._send_dingtalk_alert(webhook_url, message)
                elif channel == "slack":
                    self._send_slack_alert(webhook_url, message)
            except Exception as e:
                print(f"Failed to send {channel} alert: {e}")

    def _format_alert_message(self, result: CheckResult) -> str:
        """
        アラートメッセージのフォーマット
        """
        return f"""
🚨 Nano Banana Pro API 異常アラート

📊 ステータス詳細:
• ステータス: {result.status}
• 時刻: {result.timestamp}
• エラー: {result.error or 'N/A'}
• 連続失敗: {self.consecutive_failures} 回

🔗 監視ソース:
• Google Cloud Status: status.cloud.google.com
• OpenRouter Uptime: openrouter.ai/google/gemini-3-pro-image-preview/uptime
• APIYI 監視: apiyi.com

⚡ 推奨アクション:
1. Google Cloud ステータスページを確認
2. APIキーが有効か確認
3. ネットワーク接続状態を確認
4. APIYI テクニカルサポートに連絡
        """.strip()

    def _send_feishu_alert(self, webhook_url: str, message: str):
        """Lark(飛書)ロボットアラート"""
        payload = {
            "msg_type": "text",
            "content": {"text": message}
        }
        requests.post(webhook_url, json=payload, timeout=10)

    def _send_wechat_alert(self, webhook_url: str, message: str):
        """WeCom(企業微信)ロボットアラート"""
        payload = {
            "msgtype": "text",
            "text": {"content": message}
        }
        requests.post(webhook_url, json=payload, timeout=10)

    def _send_dingtalk_alert(self, webhook_url: str, message: str):
        """DingTalk(釘釘)ロボットアラート"""
        payload = {
            "msgtype": "text",
            "text": {"content": message}
        }
        requests.post(webhook_url, json=payload, timeout=10)

    def _send_slack_alert(self, webhook_url: str, message: str):
        """Slack ロボットアラート"""
        payload = {"text": message}
        requests.post(webhook_url, json=payload, timeout=10)

    def get_dashboard_data(self) -> dict:
        """
        ダッシュボード用のデータを取得
        """
        now = datetime.now()

        # 異なる期間の統計を計算
        periods = {
            '1h': timedelta(hours=1),
            '6h': timedelta(hours=6),
            '24h': timedelta(hours=24),
            '7d': timedelta(days=7)
        }

        stats = {}
        for period_name, delta in periods.items():
            cutoff = now - delta
            recent = [
                r for r in self.check_results
                if datetime.fromisoformat(r.timestamp) > cutoff
            ]

            if recent:
                success = sum(1 for r in recent if r.status == 'success')
                latencies = [r.latency for r in recent if r.latency]

                stats[period_name] = {
                    'total': len(recent),
                    'success': success,
                    'uptime': round((success / len(recent)) * 100, 2),
                    'avg_latency': round(sum(latencies) / len(latencies), 2) if latencies else None
                }
            else:
                stats[period_name] = None

        return {
            'model': 'nano-banana-pro',
            'current_status': self.check_results[-1].status if self.check_results else 'unknown',
            'consecutive_failures': self.consecutive_failures,
            'statistics': stats,
            'last_update': now.isoformat()
        }

# 使用例
if __name__ == "__main__":
    # アラート設定
    alert_config = AlertConfig(
        enabled=True,
        threshold=3,
        cooldown_minutes=30,
        webhook_urls={
            "feishu": "https://open.feishu.cn/open-apis/bot/v2/hook/xxx",
            # "wechat": "https://qyapi.weixin.qq.com/cgi-bin/webhook/send?key=xxx",
        }
    )

    # 監視インスタンスの作成
    monitor = EnterpriseMonitor(
        api_key="your-apiyi-key",
        base_url="https://api.apiyi.com/v1",
        alert_config=alert_config
    )

    # チェック実行
    result = monitor.health_check()
    print("チェック結果:", asdict(result))

    # ダッシュボードデータの取得
    dashboard = monitor.get_dashboard_data()
    print("ダッシュボードデータ:", json.dumps(dashboard, indent=2, ensure_ascii=False))
Nano Banana Pro API 監視・アラート設定
通知チャンネルの連携
| チャンネル | Webhook 形式 | 適用シーン |
|---|---|---|
| Feishu (飛書) | open.feishu.cn/open-apis/bot/v2/hook/xxx | 中国国内企業の第一候補 |
| WeCom (企業微信) | qyapi.weixin.qq.com/cgi-bin/webhook/send | WeChatエコシステムユーザー |
| DingTalk (釘釘) | oapi.dingtalk.com/robot/send | アリババ系企業 |
| Slack | hooks.slack.com/services/xxx | 海外チーム |
| メール | SMTP 設定 | 正式な記録用 |
アラートレベルの定義
# アラートレベル設定
ALERT_LEVELS = {
    'info': {
        'triggers': ['rate_limited'],
        'channels': ['log'],
        'color': '#36a64f'
    },
    'warning': {
        'triggers': ['timeout', 'degraded'],
        'channels': ['feishu', 'slack'],
        'color': '#ff9800'
    },
    'critical': {
        'triggers': ['api_error', 'error'],
        'channels': ['feishu', 'wechat', 'slack', 'email'],
        'color': '#f44336'
    }
}
💰 コスト最適化: 予算を抑えたいプロジェクトでは、APIYI (apiyi.com) プラットフォーム経由で Nano Banana Pro API を呼び出すことを検討してください。このプラットフォームは、柔軟な課金体系と組み込みの監視機能を提供しており、自前で監視システムを構築するコストを削減できます。
Nano Banana Pro API 監視のベストプラクティス
監視戦略の組み合わせ
業務の重要度に応じて、適切な監視戦略の組み合わせを選択してください。
| 業務レベル | 公式ステータスページ | サードパーティ監視 | アクティブプローブ | 通知チャンネル |
|---|---|---|---|---|
| コア業務 | ✅ 購読 | ✅ OpenRouter | ✅ 1分間隔 | マルチチャンネル |
| 重要業務 | ✅ 購読 | ✅ OpenRouter | ✅ 5分間隔 | Feishu + メール |
| 一般業務 | ✅ 購読 | オプション | ✅ 15分間隔 | Feishu |
| テスト環境 | オプション | – | ✅ 30分間隔 | ログ |
障害対応フロー
異常を検知
    ↓
影響範囲の確認 (本番/テスト)
    ↓
公式ステータスページを確認
    ↓
├── 公式側で障害を確認 → 復旧待ち + ユーザーへ通知
├── 公式側は正常 → 自社設定の確認
│   ├── APIキーの有効性
│   ├── クォータ(使用枠)の使用状況
│   ├── ネットワーク接続状態
│   └── リクエストパラメータの整合性
└── 特定不可 → テクニカルサポートへ連絡
監視データの分析
import pandas as pd
from datetime import datetime, timedelta

def analyze_monitoring_data(check_results: list) -> dict:
    """
    監視データを分析し、レポートを生成します
    """
    df = pd.DataFrame(check_results)
    df['timestamp'] = pd.to_datetime(df['timestamp'])

    # 時間単位での集計
    df['hour'] = df['timestamp'].dt.floor('H')
    hourly_stats = df.groupby('hour').agg({
        'status': lambda x: (x == 'success').mean() * 100,
        'latency': 'mean'
    }).rename(columns={
        'status': 'uptime_pct',
        'latency': 'avg_latency'
    })

    # 異常な時間帯の特定
    anomalies = hourly_stats[hourly_stats['uptime_pct'] < 99]

    # レイテンシの推移
    df['date'] = df['timestamp'].dt.date
    daily_latency = df.groupby('date')['latency'].mean()

    return {
        'hourly_stats': hourly_stats.to_dict(),
        'anomaly_periods': anomalies.index.tolist(),
        'daily_latency_trend': daily_latency.to_dict(),
        'overall_uptime': df[df['status'] == 'success'].shape[0] / len(df) * 100
    }
よくある質問
Q1: Nano Banana Pro API の監視頻度はどのくらいが適切ですか?
監視頻度は、ビジネスの重要性によって異なります:
- コアとなる本番環境: 1〜2分おきにチェックすることをお勧めします
- 重要な業務: 5分おきにチェック
- 一般的な業務: 10〜15分おきにチェック
APIYI(apiyi.com)プラットフォームでは、無料のテストクレジットを取得して、監視スキームの実現可能性を素早く検証できます。監視コストとレスポンス速度のバランスに注意してください。
Q2: Nano Banana Pro の一時的な変動と実際の故障をどのように区別すればよいですか?
以下の戦略を採用することをお勧めします:
- 連続失敗のしきい値: 3回以上連続で失敗した場合にのみアラートをトリガーするように設定する
- スライディングウィンドウ: 5分以内の失敗率が50%を超えた場合に故障とみなす
- 複数ソースによる検証: 公式ステータスページを同時にチェックし、公式側の障害かどうかを確認する
- レート制限(Rate Limit)の除外: レート制限は故障ではありません
APIYI(apiyi.com)プラットフォームの監視パネルを使用すると、過去の可用性の傾向を直感的に確認でき、システム的な故障かどうかを迅速に判断できます。
Q3: OpenRouter のサードパーティ監視データは信頼できますか?
OpenRouter は有名な AI モデルアグリゲータープラットフォームであり、その監視データは参考価値があります:
- メリット: 世界中のユーザーのリクエストデータを集約しているため、サンプル数が多い
- 限界: OpenRouter 自身のネットワーク経路の問題が含まれている可能性がある
- アドバイス: 公式ステータスページと自前の監視データを組み合わせて総合的に判断する
Q4: アラートが多すぎて「アラート疲れ」が起きる場合はどうすればよいですか?
アラート疲れはよくある問題です。以下の対策を推奨します:
- アラートレベルの設定: Info、Warning、Critical を区別する
- クールダウン時間の設定: 同一の問題については、30分以内に1回だけ通知する
- アラートの集約: 類似した問題を1つのアラートにまとめる
- アラートの抑制: メンテナンス期間中は一時的にアラートをオフにする
- 継続的な最適化: 定期的に誤報を振り返り、しきい値を調整する
まとめ
Nano Banana Pro API の可用性監視は、画像生成ビジネスの安定性を確保するための重要な要素です。本記事では、3つの実用的な監視方法を紹介しました:
- Google 公式ステータスページ: Cloud Status と AI Studio Status を監視し、一次情報を入手する
- OpenRouter サードパーティ監視: openrouter.ai の Uptime ページを利用して、コミュニティレベルの可用性データを取得する
- アクティブ・プローブ監視: 定期的な API 呼び出しにより、エンドツーエンドの可用性を検証する
監視スキームの効果を素早く検証するには、APIYI(apiyi.com)の利用をお勧めします。このプラットフォームは統合された API インターフェースと組み込みの監視パネルを提供しており、開発者の運用コスト削減を支援します。
著者: APIYI 技術チーム
技術交流: AI API の活用テクニックやベストプラクティスの詳細は、APIYI(apiyi.com)をご覧ください。
更新日: 2026-01-28
関連リソース
| リソースタイプ | 説明 |
|---|---|
| Google Cloud Status | status.cloud.google.com |
| AI Studio Status | aistudio.google.com/status |
| OpenRouter Uptime | openrouter.ai/google/gemini-3-pro-image-preview/uptime |
| APIYI 公式サイト | apiyi.com |