
Author’s note: The same group of Chinese open-source models ranks in nearly reverse order on Menlo Ventures’ spending chart and OpenRouter’s request chart. This article breaks down what each chart measures and offers a practical five-step model selection process.
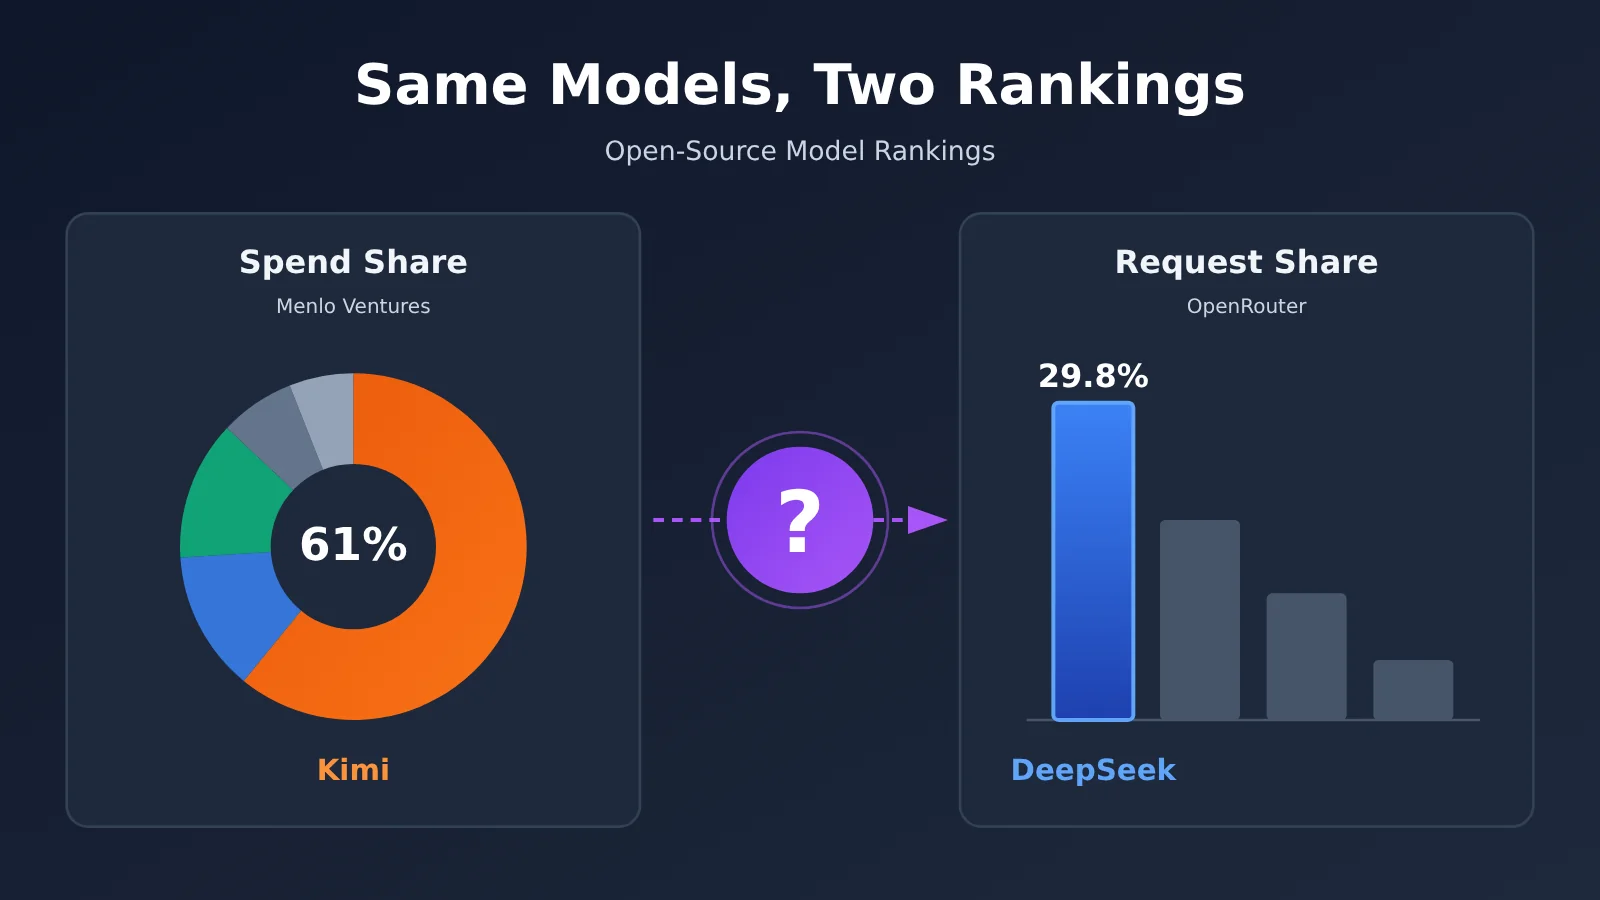
In early November, two sets of data came out. A Menlo Ventures report showed that Kimi accounted for 61% of US enterprise spending on open-source models. OpenRouter’s weekly rankings showed that DeepSeek handled 29.8% of the platform’s text requests. The leaders were different, and the rankings were nearly reversed. Many tech leads had the same first reaction: Which one should we trust?
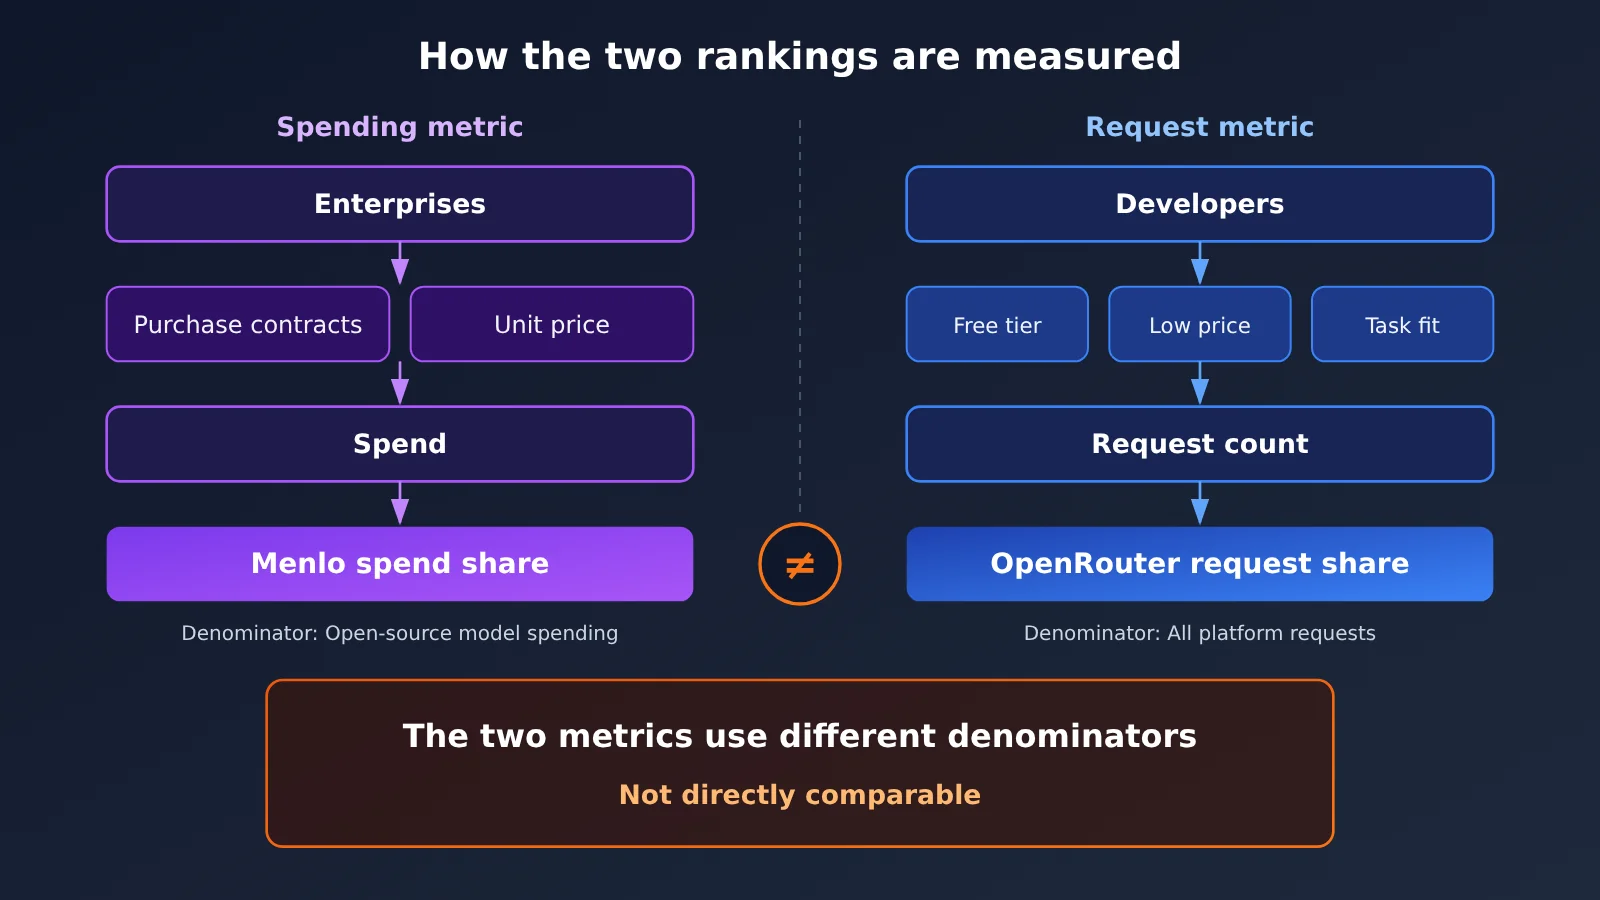
The answer is that the two charts don’t contradict each other—they measure different things. The spending chart shows which providers enterprises are paying, while the request chart shows which models developers are calling on a particular platform. You can’t pick a model by copying either ranking. You need to assess your own tasks and how you measure costs. Rankings can narrow your shortlist, but they can’t make the choice for you.
This isn’t another rankings recap. We’ll look at each chart’s sample, time window, and limitations, explain how falling unit prices and rising usage affect cost structure, and finish with a five-step model selection checklist.
Open-Source Model Rankings at a Glance: Why Kimi and DeepSeek Each Took First Place
Bottom line: Menlo Ventures measures enterprise spending, while OpenRouter measures platform requests. Their samples, time periods, and metrics are different.
These two datasets often come up in the same discussion, but they have completely different denominators. Menlo Ventures’ figures come from a survey of US enterprise AI decision-makers. They’re survey estimates, not audited billing records. OpenRouter’s figures come from requests on its own platform, so they reflect its users’ behavior—not the market as a whole.
| Ranking | What it measures | Sample/time period | Key rankings | Best used to assess |
|---|---|---|---|---|
| Menlo Ventures 2026 State of Enterprise AI Report | Share of spending on open-source models by US enterprises | Nearly 400 US enterprise AI decision-makers, surveyed September 8–26, 2026; published November 3 | Kimi 61%, DeepSeek 15%, GLM 11%, Meta Llama 7%, Qwen 3% | Enterprise purchasing preferences, where budgets are going, and which models have made it into formal contracts |
| OpenRouter weekly rankings | Share of text requests on the platform | OpenRouter platform, October 26–November 1 | DeepSeek 29.8%, OpenAI 18.8%, Z.ai 11.9%, Qwen 5.6% (sixth) | Developer activity, price-sensitive usage, and community interest |
As the table shows, the two rankings don’t even include the same players. Menlo counts only open-source models, while OpenRouter also includes closed-source providers such as OpenAI and Google. Comparing the percentages directly means comparing different metrics.
How to Read Menlo Ventures’ Spending Rankings: Kimi Takes 61% of Open-Source Model Spending
Bottom line: Menlo Ventures’ data shows that Chinese open-source models have made it into US enterprise budgets, but the figures are survey estimates—not a ranking of model capabilities.
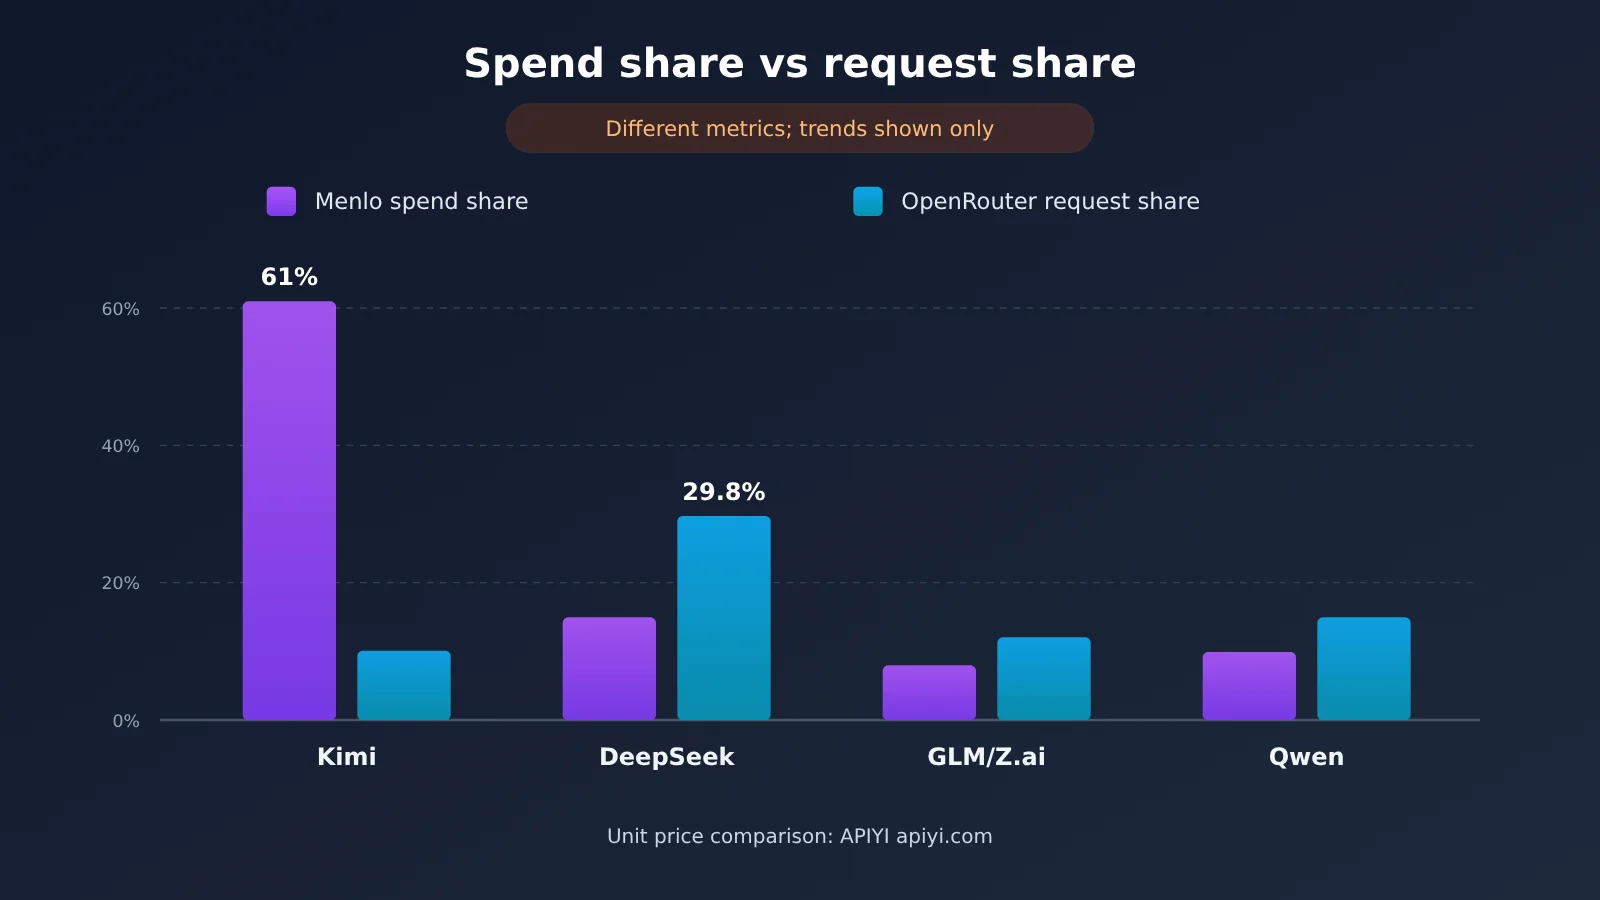
The headline figure in the report is that Chinese models account for 89% of US enterprise spending on open-source models. Kimi alone takes 61%, followed by DeepSeek at 15%, GLM at 11%, and Qwen at 3%. Among non-Chinese models, Meta Llama accounts for 7%.
| Model | Share of US Enterprise Open-Source Model Spending | Key Takeaway |
|---|---|---|
| Kimi | 61% | Highest share, potentially due to enterprise procurement channels and pricing |
| DeepSeek | 15% | Second in spending, but more active in terms of model invocations |
| GLM | 11% | Has secured a steady place in enterprise budgets |
| Meta Llama | 7% | Highest share among non-Chinese open-source models |
| Qwen | 3% | Smaller spending share, with some presence in model invocations |
These numbers make more sense in context. The report estimates that annualized global enterprise AI deployment spending is around $176.8 billion, growing more than 100-fold in three years. Frontier labs account for 69% of deployment spending, while open-source models make up just 4% of overall model spending. So “Kimi takes 61%” means 61% of that small open-source slice—not 61% of the entire enterprise AI market.
The survey data also relies on respondents’ estimates of their own budgets, and the nearly 400 respondents represent US enterprises only. The sensible takeaway is that the data points to a directional trend in enterprise purchasing. The specific percentages are survey estimates that need to be validated by more data.
How to Read the OpenRouter Request Rankings: DeepSeek Takes 29.8% of Requests
The bottom line: OpenRouter’s weekly rankings show how popular models are with developers on that platform. They’re useful for spotting trends, but they don’t represent market share across the whole industry.
In the week of October 26 to November 1, DeepSeek ranked first with 29.8% of text requests, up 7% week over week. OpenAI came second at 18.8%, Google’s share fell from 14.4%, Z.ai ranked fourth at 11.9%, and Qwen came sixth at 5.6%.
| Ranking | Provider | Request share | Change |
|---|---|---|---|
| 1st | DeepSeek | 29.8% | +7% week over week |
| 2nd | OpenAI | 18.8% | — |
| Declining | Down from 14.4% | Share fell | |
| 4th | Z.ai | 11.9% | — |
| 6th | Qwen | 5.6% | — |
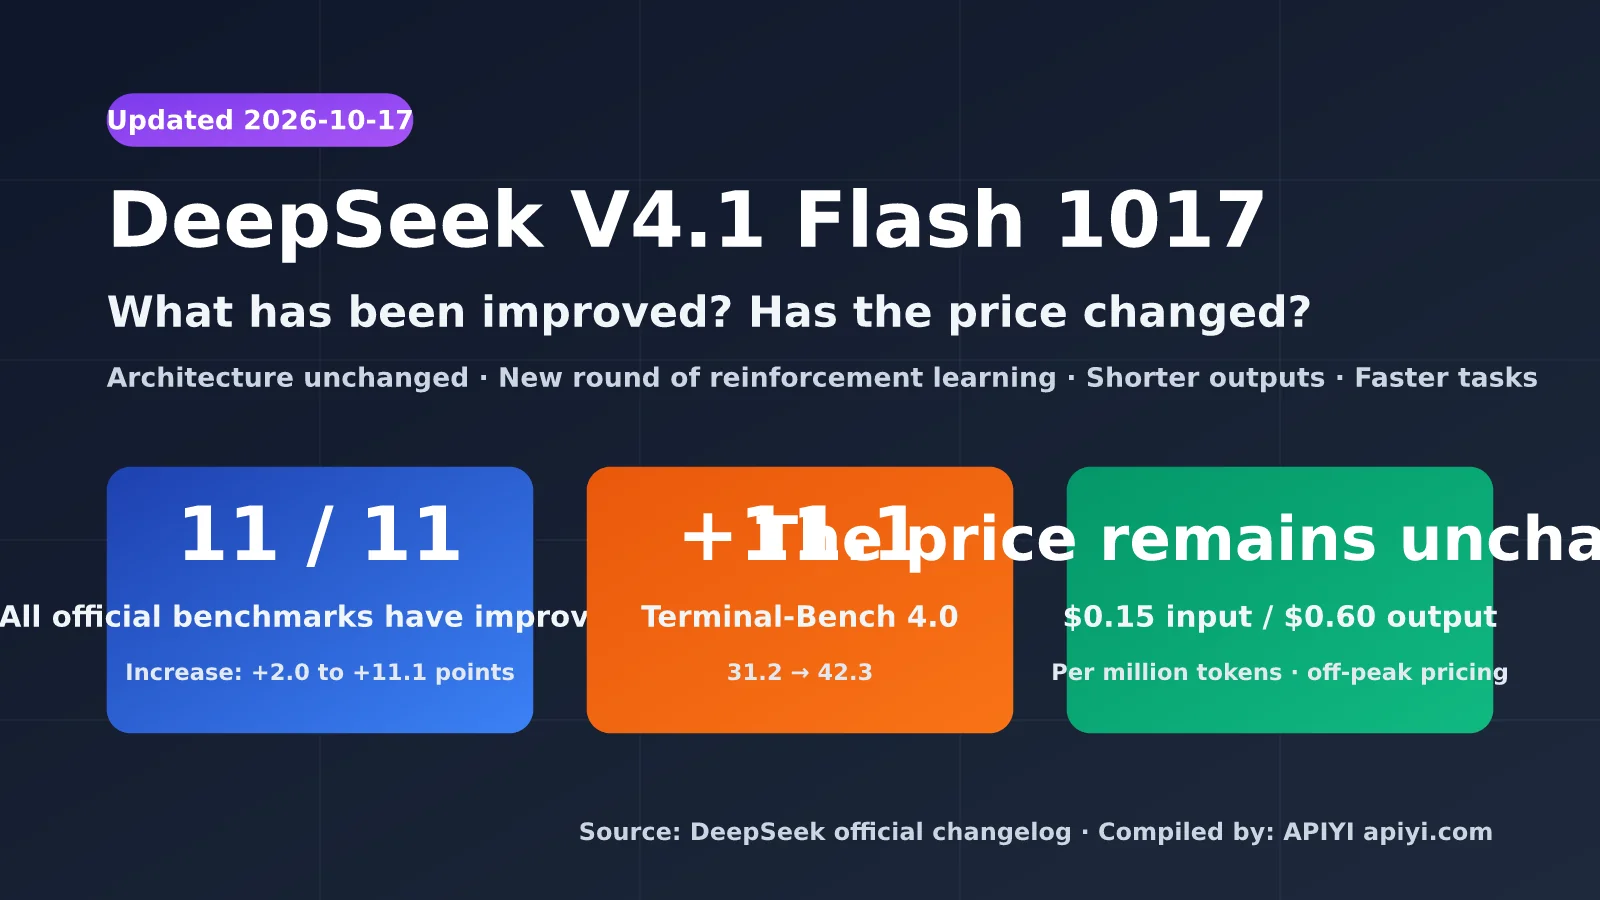
Two other trends are worth noting. Chinese models have surpassed US models in token usage for 27 consecutive weeks, and four of the top five individual models by weekly usage are Chinese. During the same period, DeepSeek upgraded its model to DeepSeek V4.1-Flash-1017 without changing its API invocation method or pricing, making the migration relatively easy for developers who had already integrated it.
Reliability is also worth watching. On November 3, DeepSeek’s web interface and API experienced a partial outage lasting about an hour. High usage doesn’t mean a service is always available, which is why it’s worth keeping a backup model, as we’ll discuss later. For the exact model ID and pricing after a new version launches, check the model list in the APIYI apiyi.com console.
Why Open-Source Model Spending and Request Rankings Are Reversed
The short answer: Five factors explain the difference—pricing, procurement methods, free usage, task fit, and platform coverage. It doesn’t mean either ranking is “wrong.”
Spending share is roughly “usage × price,” with contracts and procurement arrangements also playing a role. Request share simply counts calls, regardless of cost. A model with higher prices and enterprise contracts can rank higher by spending. A cheaper model that’s widely used by developers can rank higher by requests.
| Factor | Effect on spending share | Effect on request share |
|---|---|---|
| Unit price | Higher prices mean greater spending for the same usage, increasing spending share | Lower prices encourage more trials, increasing request volume |
| Enterprise procurement | Contracts, private deployments, and service agreements count toward spending | These may not go through OpenRouter, so they aren’t visible on the platform |
| Free usage | Free calls don’t generate spending | Free calls count toward request volume |
| Task fit | Token-heavy tasks like long-document processing and Agent workflows drive up costs | Short conversations and batches of small tasks drive up request counts |
| Platform coverage | Covers only the US enterprises surveyed | Covers only OpenRouter users |
Through this lens, Kimi may have an advantage in enterprise procurement channels and pricing, giving it a higher spending share. DeepSeek has lower prices and an active developer community, so it sees more requests. These are reasonable inferences based on what each report measures; neither report provides a breakdown by factor.
There’s another often-overlooked detail: Different versions of the same model, access channels, and cache hit rates can all create gaps between spending and usage figures. If a team gets a lot of cache hits, its requests still count, but its actual spending can be much lower.
Open-Source Model Pricing and Usage: What a 70% Price Drop and 22.5× Usage Growth Mean
Bottom line: A lower unit price doesn’t necessarily mean lower total costs. Comparing the cost to complete a task is more reliable than comparing the price per million tokens.
The Menlo report highlights a set of figures: The average token price fell from $0.45/million tokens to $0.13/million tokens, a drop of about 70%, while usage grew 22.5× over the same period. A rough calculation using those figures suggests total spending rose rather than fell, reaching about 6.5× its original level. This is only an illustration based on the report’s averages; actual results will vary by team.
The pattern is even clearer with open-source models. They account for 19% of enterprise token usage but just 4% of model spending. In other words, a large volume of tokens runs through inexpensive open-source models, while most of the money still goes to frontier closed-source models.
For developers, lower prices encourage more model invocations, especially for agents and batch jobs. Actual costs also depend on several factors:
- Cache hits: Whether repeated system prompts and long contexts hit the cache directly affects the effective price.
- Context length: For long-document tasks, input tokens often far outnumber output tokens.
- Retries: Retries caused by inconsistent output or formatting errors can multiply costs.
- Tool-call rounds: An agent task may involve more than a dozen back-and-forth rounds, so a low unit price can still add up.
When comparing prices, start by checking the list prices and billing methods for candidate models in the APIYI apiyi.com console. Make sure you understand how input, output, and cache usage are billed separately. Then run a small batch of your own tasks and calculate the cost to complete each one. That figure is more useful than the list price alone.
How to Choose an Open-Source Model: Use Leaderboards to Narrow the Field, Then Let the Task Decide
The bottom line: Leaderboards give you a shortlist. The final decision should come down to task fit, cost, stability, and validation on a small sample.
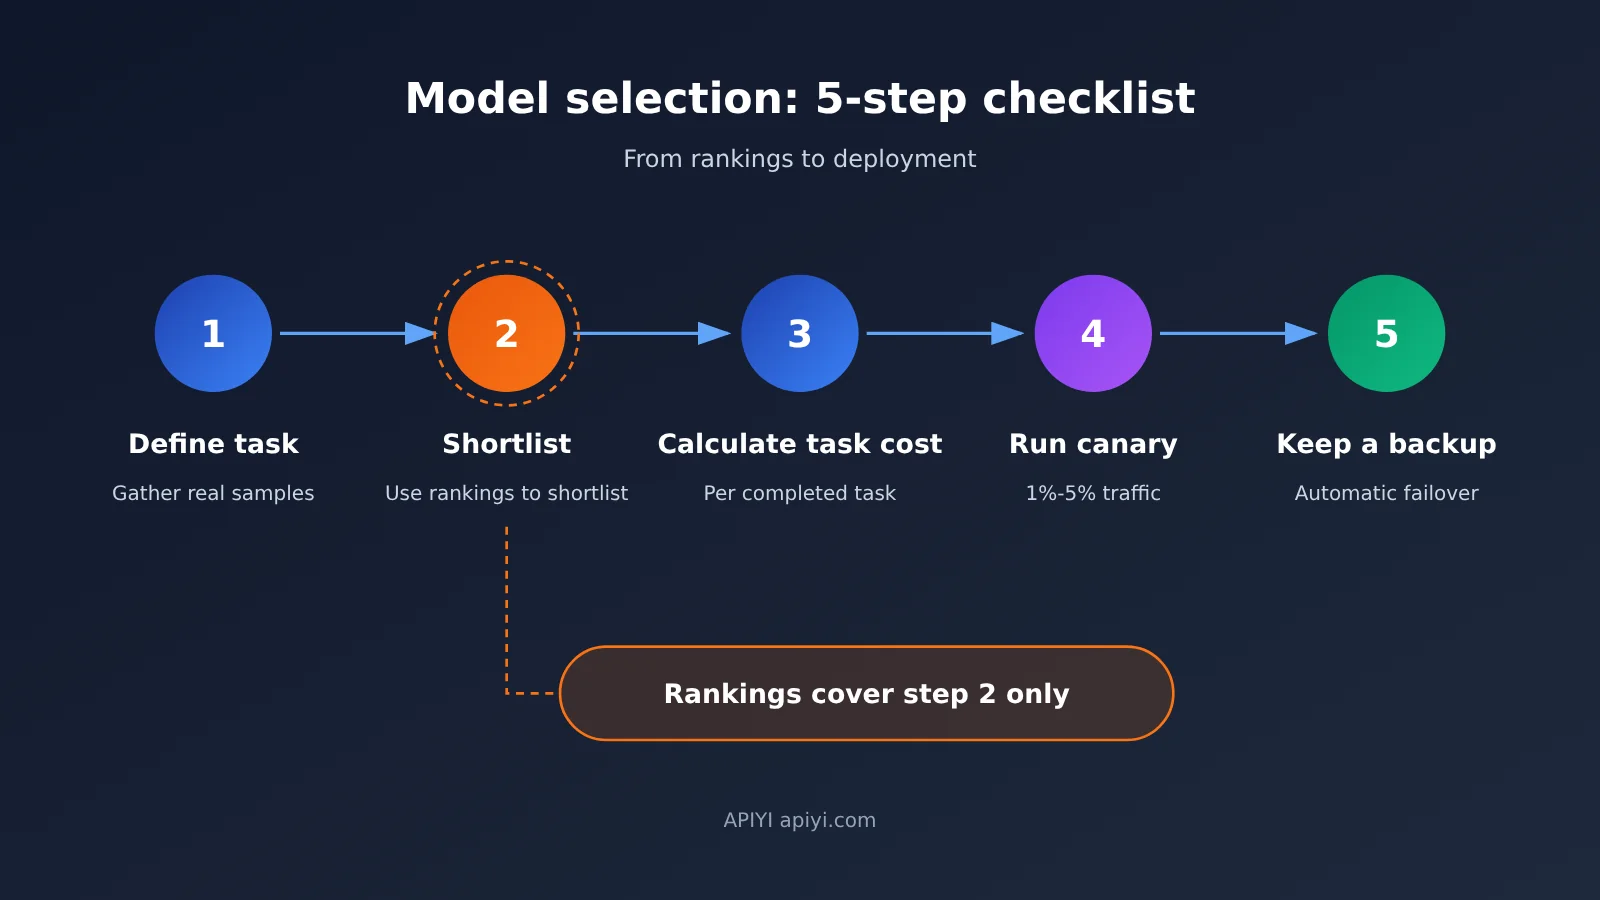
Work through the selection process in this order: task → cost → stability → validation → backup. The table below lists the questions to ask and how to check each factor.
| Factor | Questions to ask | How to validate | Impact on cost |
|---|---|---|---|
| Task fit | Is the main workload coding, long documents, multimodal tasks, or Agent tool calls? | Prepare 30–100 real task samples and review the outputs manually | A poor fit means more retries and manual edits |
| Pricing and caching | What are the rates for input, output, and cache hits? | Check the model list and billing details in the console, then measure the cache hit rate | Determines the actual price per million tokens |
| Context | How long is the longest input? Does performance drop with very long inputs? | Test truncation and recall using your longest real documents | Long contexts directly increase input token usage |
| Rate limits | Are the concurrency and requests-per-minute limits high enough? | Load-test against peak traffic | Rate limiting can require queuing or switching models, increasing latency |
| Regional availability | Is the model reliably accessible from your deployment region? | Make actual calls from the production region | If it isn’t available, you’ll need another provider |
| Stability | Have there been recent outages? How long does recovery take? | Check incident history and monitor error-rate logs | Outages can lead to retry costs and business losses |
Comparing multiple models is the most time-consuming part of this process. If you have to register and integrate a separate SDK for each candidate, setup alone can take days. With APIYI apiyi.com, a single API key gives you access to models from OpenAI, Claude, Gemini, DeepSeek, Kimi, and others. The interface is compatible with the OpenAI format: set base_url to https://api.apiyi.com/v1 and change the model parameter in your request to switch models. You can then run the same samples across candidates for a quick side-by-side comparison.
For stability, don’t rely on vendor announcements alone. The DeepSeek outage on November 3 is a reminder that any single model can become temporarily unavailable. In the APIYI apiyi.com console, you can view usage and invocation logs by model, including error rates, latency, and token consumption. That makes it useful for observing how candidates perform during a canary rollout. The platform uses multi-node deployment and intelligent routing, and provides automatic fallback. Configure a backup model on the application side as well, so you can switch to it if the primary model fails and limit the impact of a single point of failure.
For a canary rollout, start with 1%–5% of real traffic and monitor error rates, latency, and cost per task for several days. Increase traffic gradually once the numbers are stable—don’t switch everything over at once based on a leaderboard.
Open-Source Model Leaderboard FAQ
Bottom line: These five questions cover the most common misconceptions about open-source model leaderboards.
Q1: Does Kimi’s 61% share of spending mean it’s the best model?
No. Spending share shows where the money goes. It’s influenced by pricing, enterprise procurement contracts, and sales channels, and doesn’t directly reflect model capabilities. Menlo’s figures are survey estimates covering only US enterprise spending on open-source models. Leading in spending doesn’t mean leading in capability—you need to evaluate models on your own tasks.
Q2: Do OpenRouter request rankings represent enterprise purchasing?
No. OpenRouter tracks the share of requests on its own platform, whose users are mainly developers and small to midsize teams. Direct enterprise contracts, private deployments, and other channels aren’t included. The rankings are useful for tracking developer interest and trends in price-sensitive usage, but not for inferring how enterprise budgets are distributed.
Q3: Does a lower unit price always mean a lower total cost?
Not necessarily. If a cheaper model needs more retries, longer prompts, or more rounds of tool calls, it could end up consuming more tokens. Calculate the cost of completing a task instead: Check token usage and cost logs for each call in the APIYI apiyi.com console, then compare the total cost of having different models complete the same batch of tasks.
Q4: Can open-source models completely replace closed-source models?
It depends on the task. Menlo’s data shows that open-source models account for 19% of enterprise tokens but only 4% of spending. This suggests that many teams use open-source models for routine, high-volume tasks while leaving complex tasks to frontier closed-source models. A practical approach is to use both: Access open-source and closed-source models through APIYI apiyi.com with the same API key, then route tasks based on their difficulty.
Q5: How often should I check open-source model leaderboards?
You can browse weekly leaderboards once a month, focusing on trends rather than week-to-week fluctuations. Read annual or quarterly survey reports closely when they’re released, and check whether their definitions or samples have changed. What really matters for your decisions is ongoing monitoring of your own business metrics, such as error rates, cost per task, and user feedback. Review those weekly.
Understanding Open-Source Model Rankings: A 5-Step Selection Checklist
Bottom line: The two rankings measure different things. To read them properly, first check what they measure, then look at the samples, and finally validate candidates against your own tasks.
Key takeaways:
- Spending ≠ requests: Menlo measures enterprise spending, while OpenRouter measures platform requests. They use different denominators, so you can’t compare them directly.
- Survey ≠ audit: Menlo’s figures are survey estimates based on responses from nearly 400 US enterprise decision-makers. OpenRouter represents only its own platform.
- Cheaper ≠ lower cost: Unit prices fell by about 70%, but usage grew 22.5 times, driving total spending up. Calculate cost per task instead.
- Popular ≠ reliable: Even the model with the most requests can experience outages. Prepare a fallback in advance.
- Rankings can narrow your shortlist, but they can’t choose a model for you.
You can use this checklist the next time you select a model:
- Define the task: Write down your primary task types (coding, long documents, multimodal, Agent), and compile 30–100 real examples with evaluation criteria.
- Build a shortlist: Pick 2–3 models from each of the spending and request rankings, then add 1 closed-source model as a baseline. Keep the shortlist to 3–5 models.
- Calculate cost per task: Run the same examples through every candidate. Record token usage, cache hits, and retries, then calculate cost per task and quality scores.
- Run a canary test: Route 1%–5% of real traffic to the selected model first. Monitor error rates, latency, and costs for a few days, then increase traffic once it meets your criteria.
- Keep a fallback: Configure at least one backup model from a different provider, define switching rules, and test them regularly.
If you’d like to handle steps 3 through 5 in one place, APIYI apiyi.com lets you access candidate models with one Key, compare prices, usage, and logs in the console, and use the platform’s automatic fallback capability to configure backup switching. New users receive free testing credits, making it easy to validate a small sample first.
Data Sources
- Menlo Ventures 2026 State of AI in the Enterprise Report: Published November 3, 2026
- Link:
menlovc.com -
Notes: Enterprise AI spending, open-source model share of spending, and token price changes are survey estimates.
-
OpenRouter Model Rankings: Weekly rankings for October 26–November 1, 2026
- Link:
openrouter.ai/rankings - Notes: Text request shares and token usage trends represent only the OpenRouter platform.
Author: APIYI Technical Team
Technical discussions: If you run into pricing, rate limiting, or model switching questions during model selection, contact us through the APIYI apiyi.com homepage. For more integration resources, visit the documentation center at docs.apiyi.com.