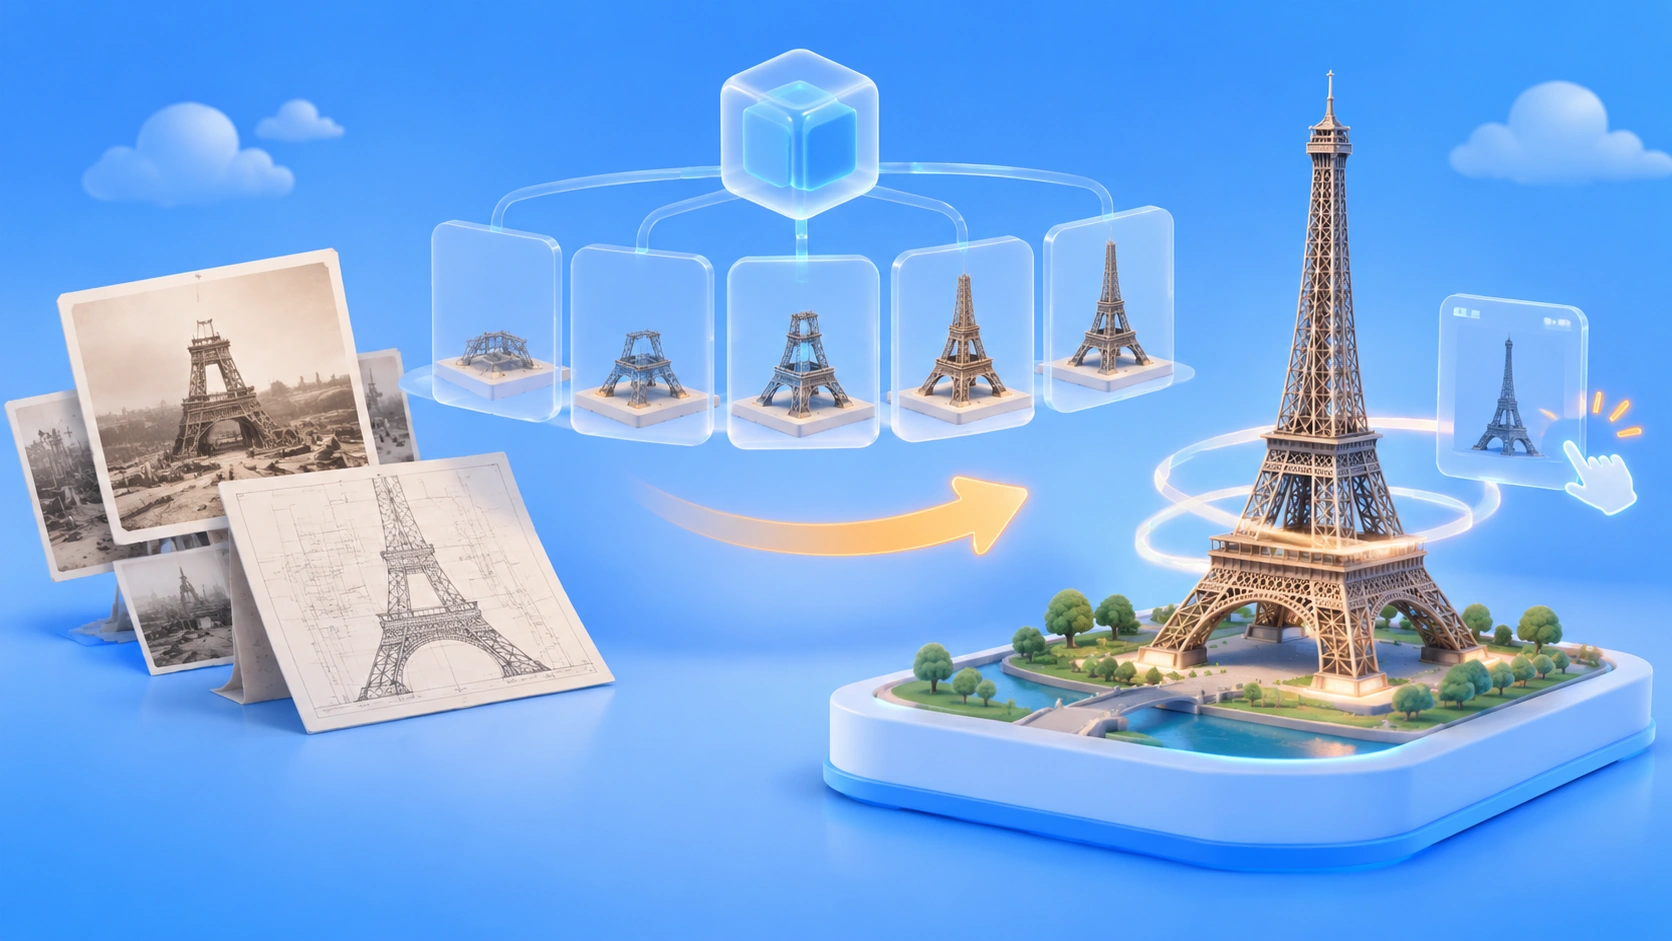
Author’s note: This article starts from Google’s Eiffel Tower demo and explains how multiple agents turn historical images and engineering documents into an interactive 3D exhibit.
Quick Glossary (to know)
- Agent: An AI program that can call tools and carry out tasks. It doesn’t just answer questions; it plans, executes, and checks its own results.
- Multi-agent collaboration: Multiple agents split up subtasks and exchange their intermediate results.
- Antigravity: Google’s AI development tool, where Gemini 4 Carbon is now available.
- Swarm (/swarm): A preview feature in Antigravity for organizing multiple agents to work together, launched on November 10, 2026.
- Engineering drawings: Documents that express an engineering design through graphics and dimensions. They’re a key geometric source for 3D reconstruction.
- Three.js: A JavaScript library for building 3D scenes on the web, so you can render and interact with them right in the browser.
- Lattice structure: A load-bearing structure built from many connected members. The Eiffel Tower is a classic iron lattice structure.
On November 10, 2026, Google officially opened up Gemini 4 Carbon, and its announcement included a vivid showcase: multiple Carbon Agents used Antigravity’s /swarm feature to turn historical photos and engineering drawings into an interactive Three.js 3D exhibit that recreates the construction of the Eiffel Tower from 1887 to 1889. The whole task was kicked off by a single prompt.
This isn’t “an AI casually drawing a tower.” Google’s official announcement and the Antigravity blog both describe this case and the Swarm mechanism. In this article, we’ll separate three kinds of information: historical facts, Google’s official description of the demo, and our own analysis and inference.
Core takeaway: By the end of this article, you’ll know which technical problems the demo actually solves, what role the multiple agents play, and how developers can use an API to try a similar “drawings to 3D” workflow.
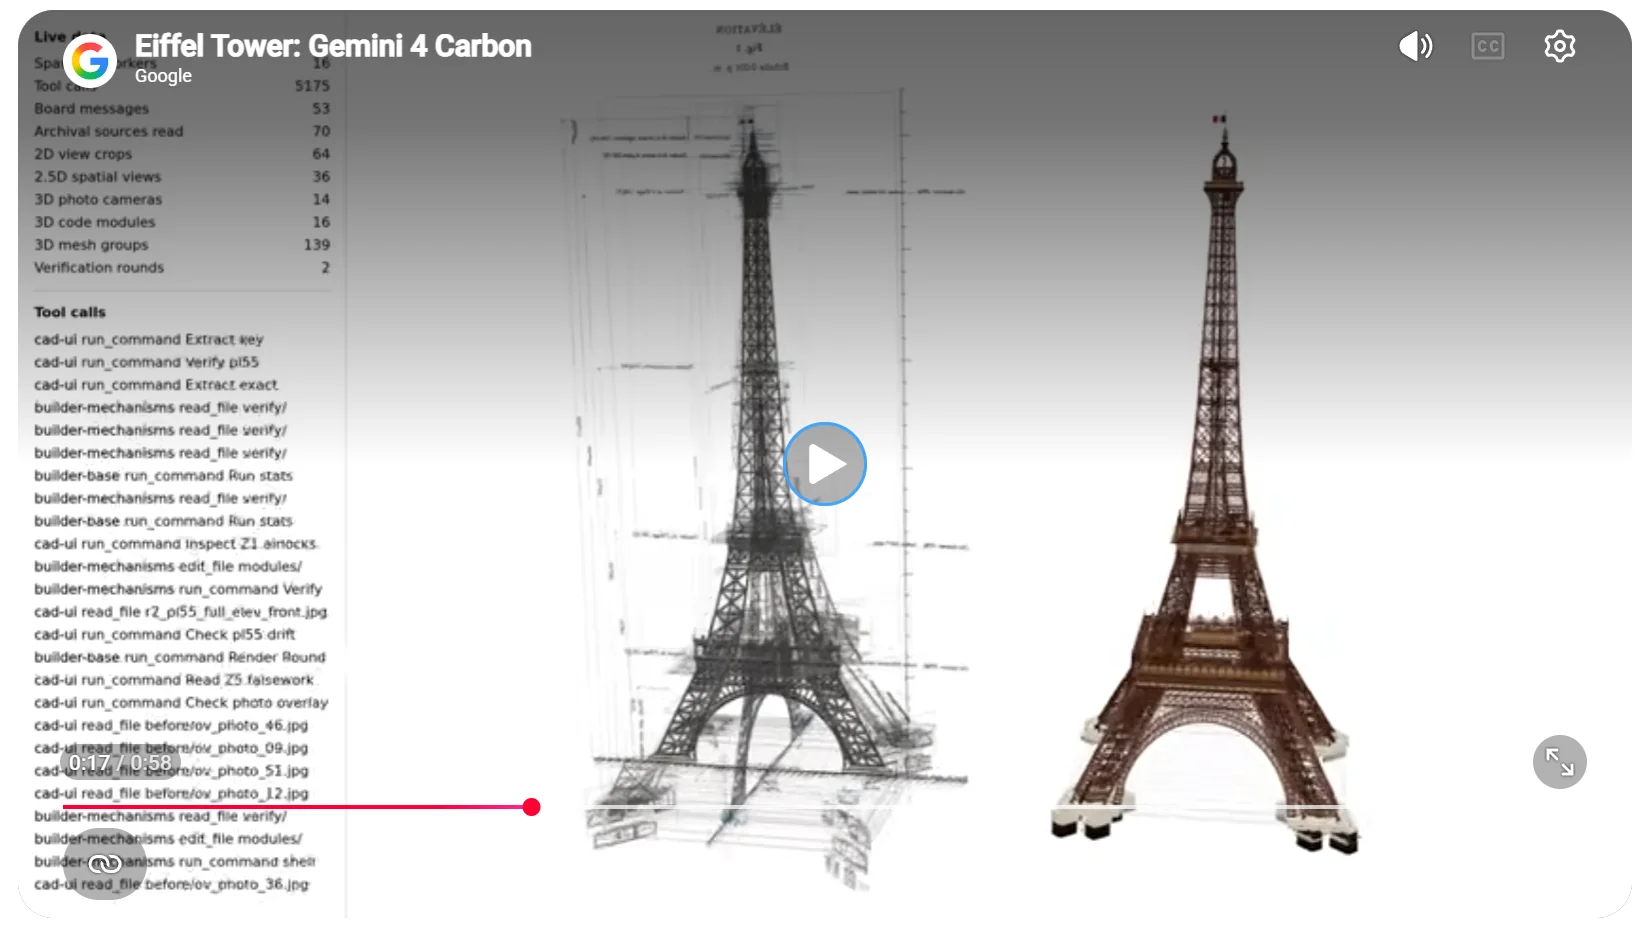
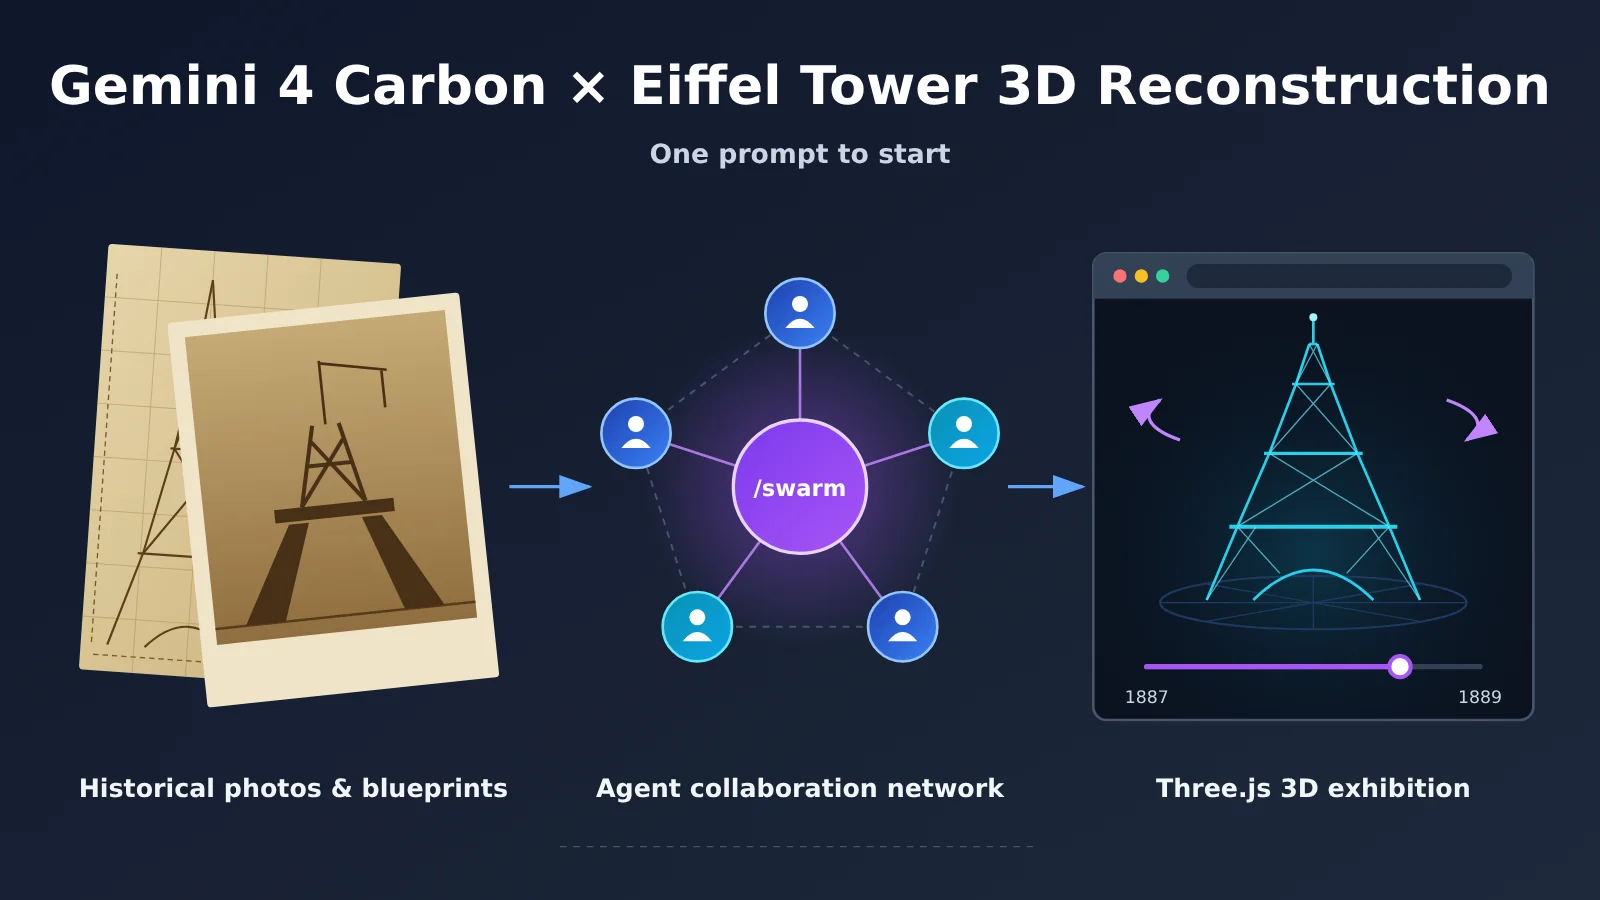
Gemini 4 Carbon Eiffel Tower Demo: Key Facts at a Glance
Let’s start with what Google’s official announcement actually confirms. The table below only lists details the announcement explicitly mentions. Anything that wasn’t disclosed is called out separately.
| Item | Details |
|---|---|
| Publisher | Google (Gemini 4 Carbon was developed by Google DeepMind) |
| Announced | November 10, 2026, alongside Carbon’s official public release |
| Tool used | Google Antigravity’s /swarm multi-agent collaboration feature (preview) |
| Models involved | Multiple Gemini 4 Carbon agents |
| Input materials | Historical photos and engineering drawings of the Eiffel Tower |
| What was recreated | The construction process from 1887 to 1889 |
| Final deliverable | An interactive Three.js 3D exhibit |
| How it was launched | A single prompt |
| Not disclosed | The exact number of agents, how work was divided, the number of iteration rounds, and token consumption for this task |
| Access channels | Gemini API, Google AI Studio, Antigravity; Gemini models are also available through OpenAI-compatible platforms such as APIYI (apiyi.com) |
One thing to keep in mind: “a single prompt” doesn’t mean “a single generation pass.” The user only issued one instruction. The breakdown, parallel processing, and checking that followed were all handled by multiple agents inside the Swarm framework. That’s the key to understanding this whole case.
Why the Eiffel Tower Is a Tough Test for Gemini 4 Carbon
Generating something that merely “looks like the tower” isn’t impressive. The real challenge is that the Eiffel Tower is a data-heavy, structurally complex piece of engineering. The figures below come from the historical archives on the Eiffel Tower’s official website.
| Project Item | Historical Data |
|---|---|
| Designed metal components | 18,038 pieces |
| Workshop drawings | 5,300 sheets |
| Engineers and designers | 50 people |
| Total iron | 7,300 tons |
| Rivets | 2.5 million |
| Construction time | 2 years, 2 months, 5 days |
The construction timeline is just as well documented. Work officially began on January 26, 1887, and the pillars started going up on July 1 of that year. The first level was finished on April 1, 1888, and the second level on August 14. On March 31, 1889, the top and the full assembly were complete. For an exhibit that “recreates the construction process,” these milestones form the backbone of the timeline.
The Eiffel Tower’s Lattice Structure and Wind Resistance
According to official historical sources, the tower’s design concept originally came from engineers Maurice Koechlin and Émile Nouguier. The architect Stephen Sauvestre contributed to the exterior design, and Gustave Eiffel drove the final plan through. The initial design used four lattice pillars that stand apart at the base and gradually converge toward the top.
The curvature of the pillars was mathematically designed to improve the structure’s resistance to wind. Every metal component was prefabricated in the workshop, specially designed and calculated, with drawings accurate to a tenth of a millimeter. That means rebuilding it isn’t a matter of “stacking geometric shapes.” You have to understand the strict relationships between the members, the curves, and the levels.
How Gemini 4 Carbon Turns 2D Historical Materials into 3D Structures
This section is our own analysis. Google hasn’t published the internal steps for this task. Working backward from the inputs and outputs, the task has to clear at least three hurdles.
- Understanding historical photos: Construction photos were taken from inconsistent angles and have limited resolution. The model has to figure out how many levels are built and what stage the tower legs have reached, then map each photo to a point on the timeline.
- Extracting geometry from the drawings: Engineering drawings contain elevations, sections, dimension callouts, and more. The model has to read off parameters like the tower leg inclination, platform heights, and member layout.
- Inferring spatial relationships and organizing them into reconstructable data: Both the photos and the drawings are 2D, so the model has to align information from multiple viewpoints, infer where each component sits in 3D space, and then organize it all into a structured description that can drive modeling code.
According to its model card, Gemini 4 Carbon accepts text, image, audio, and video input, produces text output, and has a total context budget of 1,048,576 tokens. That makes it reasonable to infer that the exhibit is delivered as Three.js code, which is just “text.” The 3D effect appears when the browser runs that code, rather than the model outputting a 3D file directly.
The same announcement from Google includes a comparable case. Carbon processed 7 public urban planning PDFs, extracted 206 engineering drawing views, and after 10 rounds of overnight iteration produced an interactive Three.js building model with roughly 906,000 triangles. The two cases follow a similar pattern: heterogeneous materials → spatial information → interactive 3D.
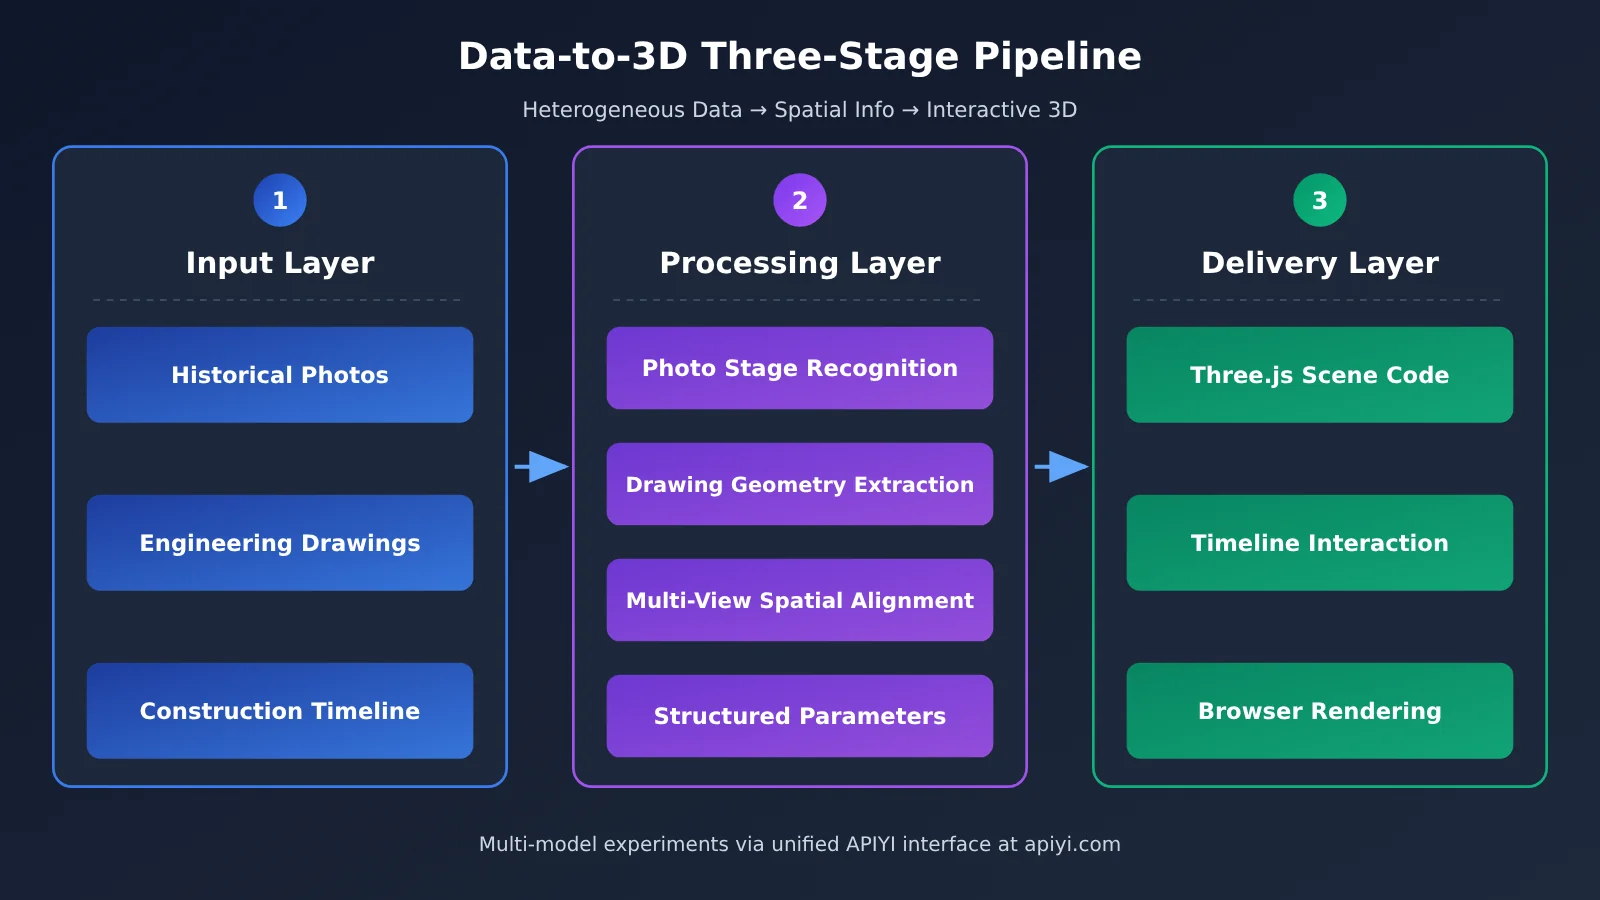
How Gemini 4 Carbon’s Multi-Agent Swarm Could Build the Eiffel Tower Exhibition
Google has confirmed that this case was completed by multiple Carbon Agents working together through /swarm, but it hasn’t disclosed how the work was actually divided up for this particular task. So what follows describes the general Swarm mechanism from the official Antigravity blog, not a play-by-play of this case.
| Swarm Component | Responsibility (per the official description) | Possible role in a “source materials to 3D” task (our analysis) |
|---|---|---|
| Coordinator | Receives the overall task, breaks it down, assigns subtasks, and consolidates results | Splits “recreate the construction process” into subtasks like photo analysis, blueprint extraction, modeling, and timeline |
| Parallel Workers | Execute subtasks in parallel inside isolated Git worktrees | Each handles different source materials or scene modules, so they don’t overwrite each other’s code |
| Adversarial Verifiers | Review changes, run tests, and challenge unreasonable modifications | Check whether structural proportions contradict the blueprints and whether the page renders correctly |
| Shared Message Board | Append-only log of collaboration progress; Agents sleep when idle | Collects intermediate results from each subtask for later stages to read |
Google says Agents don’t consume tokens while they sit idle waiting, but it also warns that running multiple Agents in parallel still noticeably increases overall usage. The official guidance is to assign models by role: architecture design, task coordination, and complex audits go to Carbon, while routine implementation and parallel file edits go to faster, lighter models.
This kind of division of labor makes a lot of sense for rebuilding engineering materials. The coordinator needs deep reasoning to work out which materials correspond to which construction phase, while repetitive work like generating structural members in bulk or stitching a scene together doesn’t need the most expensive model at every step. Verification is your quality insurance, since a single model generating a 3D structure over a long run can easily suffer from proportion drift.
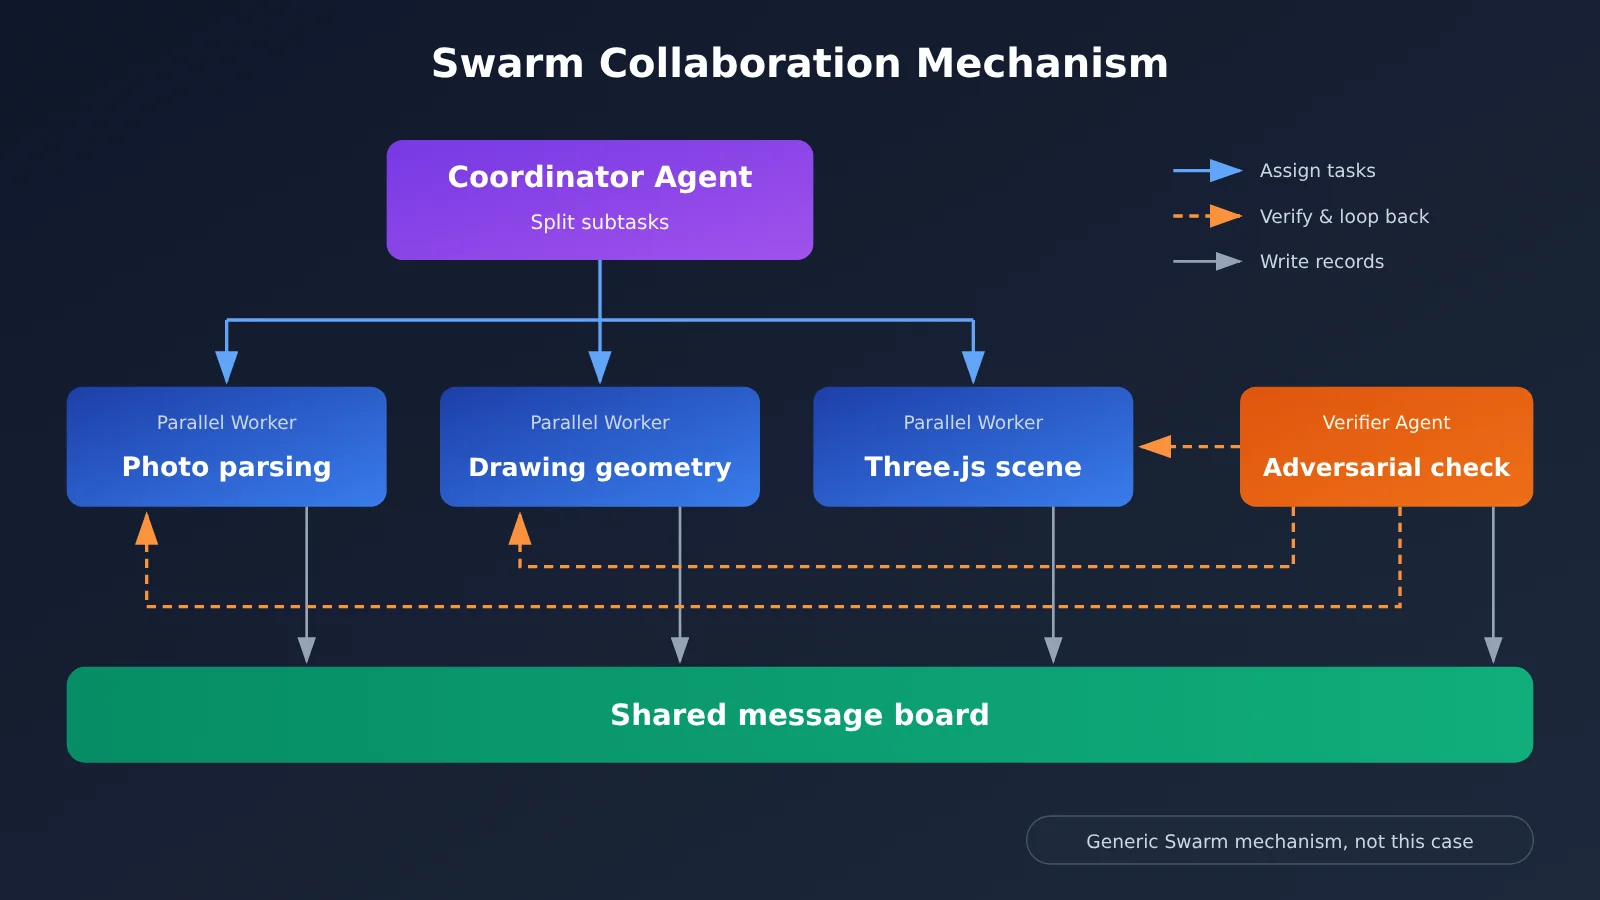
How to Try a Similar Drawing-to-3D Task with the Gemini 4 Carbon API
Antigravity’s /swarm is an in-product feature, so developers can’t reproduce it with a single API parameter. You can, however, build a simplified pipeline with the API to get a feel for the “read drawing → extract parameters → generate Three.js” flow. The official model ID is gemini-4-carbon.
Minimal Example: Have Carbon Analyze a Construction Photo
import base64
from openai import OpenAI

client = OpenAI(
    api_key="YOUR_API_KEY",
    base_url="https://api.apiyi.com/v1"  # Unified OpenAI-compatible endpoint
)

with open("eiffel_1888.jpg", "rb") as f:
    img_b64 = base64.b64encode(f.read()).decode()

resp = client.chat.completions.create(
    model="gemini-4-carbon",
    messages=[{"role": "user", "content": [
        {"type": "text", "text": "判断照片中铁塔建到了哪一层,估算塔柱倾角与平台高度比例,输出 JSON。"},
        {"type": "image_url", "image_url": {"url": f"data:image/jpeg;base64,{img_b64}"}}
    ]}]
)
print(resp.choices[0].message.content)
View the full implementation (simplified “coordinate–parallelize–verify” workflow)
import base64
import json
from concurrent.futures import ThreadPoolExecutor
from openai import OpenAI

client = OpenAI(
    api_key="YOUR_API_KEY",
    base_url="https://api.apiyi.com/v1"
)
MODEL = "gemini-4-carbon"


def encode(path: str) -> str:
    with open(path, "rb") as f:
        return base64.b64encode(f.read()).decode()


def ask(content, system: str = "") -> str:
    messages = []
    if system:
        messages.append({"role": "system", "content": system})
    messages.append({"role": "user", "content": content})
    resp = client.chat.completions.create(model=MODEL, messages=messages)
    return resp.choices[0].message.content


def worker_extract(path: str) -> str:
    """Parallel worker: extract structural parameters from a single photo or drawing"""
    return ask([
        {"type": "text", "text": "提取该资料中的结构信息:所属施工阶段、塔柱倾角、平台高度比例、可见杆件排布,只输出 JSON。"},
        {"type": "image_url", "image_url": {"url": f"data:image/jpeg;base64,{encode(path)}"}}
    ], system="你是结构工程资料分析员,数据不确定时标注 uncertain,不要编造。")


def builder(merged: str) -> str:
    """Builder: generate a Three.js page from the merged parameters"""
    return ask(
        "根据以下结构参数,生成单文件 HTML,使用 Three.js 构建四根格构塔柱与两层平台,"
        "并提供 1887—1889 时间轴滑块按阶段显示结构:\n" + merged
    )


def verifier(merged: str, html: str) -> str:
    """Verifier: check whether the code matches the parameters"""
    return ask(
        "检查下列 Three.js 代码是否与结构参数一致,列出比例错误、阶段错误和无法运行的代码:\n"
        f"参数:{merged}\n代码:{html}"
    )


sources = ["photo_1887.jpg", "photo_1888.jpg", "drawing_elevation.jpg"]

with ThreadPoolExecutor(max_workers=3) as pool:
    results = list(pool.map(worker_extract, sources))

merged = json.dumps(results, ensure_ascii=False)
html = builder(merged)
report = verifier(merged, html)

with open("eiffel_exhibit.html", "w", encoding="utf-8") as f:
    f.write(html)
print(report)
This code is a simplified version we put together to mimic the Swarm approach using the regular API. It isn’t Google’s internal implementation. Two things to watch out for: Carbon ignores sampling parameters like temperature and top_p, and passing thinking_budget returns an HTTP 400. The default reasoning level is MEDIUM, and higher levels burn more Tokens and respond more slowly.
🚀 Quick-start tip: For multi-image, multi-step experiments like this, it’s best to validate your prompts on a small sample first. You can grab free test credits through APIYI (apiyi.com). One API key lets you switch between Gemini, Claude, OpenAI, and other models, which makes it easy to put the “lightweight model for bulk extraction, strong reasoning model for planning and verification” split into practice.
Gemini 4 Carbon Interactive 3D Exhibition vs. Traditional Delivery Formats
Three.js lets a 3D scene run directly in the browser. Viewers don’t need to install anything. They can rotate the camera, zoom in on details, or drag a timeline to see the construction status in different years. The table below compares several common ways of presenting historical material.
| Delivery Format | Information Dimension | Interactivity | Editability | Best For |
|---|---|---|---|---|
| Static historical images | Single-view 2D | None | Can’t be modified | Archival preservation, article illustrations |
| Video / animation | Preset viewpoint + time | Play and pause only | Requires re-rendering | Documentaries, promotion |
| Standard 3D renders | 3D, but fixed viewpoint | None | Requires going back to the modeling software | Visual showcases |
| Interactive Three.js exhibition | 3D + timeline | Free camera, browse by stage | Iterable through code | Digital exhibition halls, teaching, engineering walkthroughs |
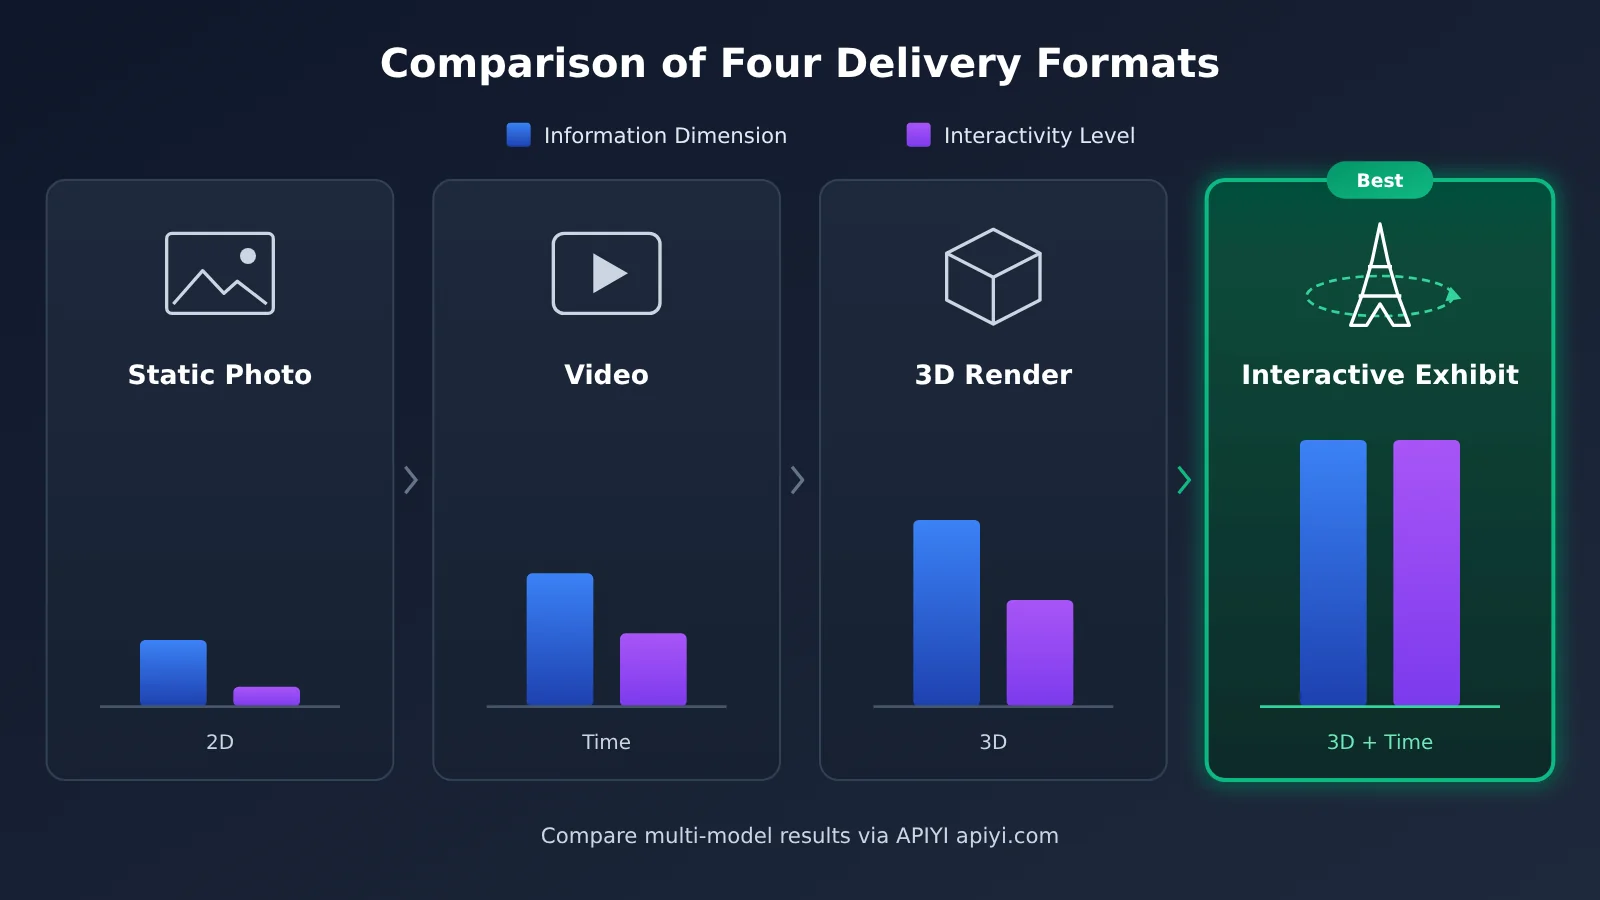
The biggest value of an interactive exhibition is traceability. Because it’s essentially code, every platform level and every tower segment maps to readable parameters. If you later find a mismatch with the original drawings, you can fix that specific part instead of starting over. This is also what makes the verification Agent useful.
Impact Analysis of the Gemini 4 Carbon Eiffel Tower Demo
First, a note on boundaries: this is a case showcased by Google itself, not a result independently verified by a third party. It shows what Carbon plus Swarm can do, but you can’t conclude from it that “any architectural material can be reliably reconstructed.”
What It Means for Developers
- Workflows shift from single calls to orchestration: Behind a single prompt, multiple agents split up the work. Developers need to pay attention to task decomposition, intermediate result formats, and validation mechanisms.
- Cost has to be calculated per task, not per unit price: Carbon launches at $2 per million input tokens and $10 per million output tokens, and the price doubles starting December 1. Thinking tokens count toward output, and running multiple agents in parallel can amplify usage further.
- Mixing multiple models is more realistic: Google recommends letting Carbon handle only planning, coordination, and auditing, while handing bulk execution off to lightweight models. This is key to keeping costs under control.
What It Means for the Industry
- Digitizing historic buildings: Many buildings exist only in photos and drawings. With a lower barrier to entry, they could be turned into interactive models that researchers can compare against the originals.
- Reconstructing engineering records: The urban planning PDF case and the Eiffel Tower case point in the same direction: extracting spatial information from heterogeneous documents.
- Digital exhibitions and educational visualization: Museums and teachers can turn abstract numbers like “5,300 drawings and 2.5 million rivets” into scenes where students can drag a timeline and watch the structure come together.
There are limits to keep in mind, too. /swarm is still a preview feature, and the model card explicitly warns that Carbon may hallucinate, and that high reasoning levels can respond slowly or even time out. In engineering scenarios that demand strict precision, AI-reconstructed results should still be reviewed by professionals.
FAQ
Q1: What did the Gemini 4 Carbon Eiffel Tower demo actually do?
According to Google’s November 10 announcement, multiple Gemini 4 Carbon agents used Antigravity’s /swarm feature, took historical photos and engineering drawings as input, and, kicked off by a single prompt, generated an interactive Three.js 3D exhibit recreating the construction of the tower from 1887 to 1889.
Q2: Does a single prompt mean the model generated the whole exhibit in one shot?
No. The user issued just one instruction, but multiple agents then broke the task down inside the Swarm framework, worked in parallel, and checked each other’s output. Google hasn’t published how this particular case divided the work. The coordinator, worker, and verifier roles are just the general mechanism Swarm uses.
Q3: Is the historical data about the Eiffel Tower in the demo reliable?
The figures cited in this article, including the 18,038 components, 5,300 drawings, 2.5 million rivets, and the construction timeline, all come from the historical archives on the Eiffel Tower’s official website. As for how precisely the Google exhibit reproduces that data, there’s no quantitative statement from the official side.
Q4: Which scenarios suit this “source material to 3D” capability?
– **Digitizing historical building archives**: turn old photos and survey drawings into browsable models.
– **Urban planning and engineering review**: extract drawing views from planning PDFs and generate interactive models.
– **Classrooms and exhibition halls**: use a timeline to show the construction stages of a major project.
Q5: Can I run similar experiments by calling Gemini 4 Carbon through the API, without Antigravity?
Yes. Paid Gemini API users can call `gemini-4-carbon` directly, with no need to buy Google AI Ultra. If you’d like to test multiple models with a single key, you can sign up at APIYI (apiyi.com) to get test credits, then use the code in this article to build a simplified “extract, generate, verify” workflow.
Q6: Is it expensive to reproduce this kind of multi-agent task?
Cost mostly depends on the reasoning level, the number of images, and the number of iteration rounds. Thinking tokens are billed as output, and running multiple agents in parallel can significantly inflate total usage. I’d suggest getting the workflow running with the MEDIUM level and a handful of sample images first, then scaling up gradually. Testing with pay-as-you-go billing through APIYI (apiyi.com) makes it easier to estimate real costs before you commit.
Q7: What are the limitations of this demo?
It’s an official Google demo, not independently verified by a third party. /swarm is still in preview, Carbon can still hallucinate, and high reasoning levels may be slow. For scenarios where engineering accuracy matters, you’ll need to check the results against the original drawings by hand.
Gemini 4 Carbon Eiffel Tower Demo: Key Takeaways
- What the case really is: Multiple Carbon Agents turn historical photos and blueprints into an interactive Three.js exhibition.
- One prompt doesn’t mean one generation pass: Behind it is the Swarm’s task decomposition and parallel collaboration.
- The engineering difficulty is real: 18,038 structural components and 5,300 drawings demand extremely high structural precision.
- The deliverable is code: Carbon outputs text, and the exhibition takes the form of editable Three.js code.
- Look at cost as a whole: Running multiple Agents in parallel multiplies usage, so mixing models by role is more economical.
- Be clear about the limits: An official demo doesn’t represent general performance, and Swarm is still a preview feature.
- How to get started: Use APIYI (apiyi.com) as a unified interface and validate the image-reading and modeling workflow on a small sample.
Summary
The Gemini 4 Carbon Eiffel Tower demo has three main highlights:
- The input is heterogeneous historical material: Photos and engineering drawings have to be understood, aligned, and converted into spatial parameters.
- The process is multi-Agent collaboration: A single prompt kicks off the Swarm, which splits the work across coordination, execution, and verification.
- The deliverable is an interactive 3D exhibition: Three.js lets you freely explore the 1887–1889 construction process right in the browser.
For developers, the most useful takeaway is the orchestration approach: a deep reasoning model handles planning, lightweight models handle execution, and a verification step acts as the safety net. We recommend using APIYI (apiyi.com) to run through the workflow on a small set of materials first, then deciding whether a larger multi-Agent task is worth the investment.
📚 References
- Google Official Announcement: Gemini 4 Carbon is now available: Eiffel Tower case study and /swarm release info
- Link:
blog.google/innovation-and-ai/models-and-research/gemini-models/gemini-4-carbon-now-available/ -
Notes: The original description of the case, availability scope, and pricing changes
-
Google Antigravity Official Blog: Gemini 4 Carbon in Google Antigravity
- Link:
antigravity.google/blog/gemini-4-carbon-in-google-antigravity/ -
Notes: Swarm coordination, parallel work, adversarial verification, and the message board mechanism
-
Gemini 4 Carbon Model Card: Google DeepMind model card
- Link:
deepmind.google/models/model-cards/gemini-4-carbon/ -
Notes: Input/output modalities, context quotas, and known limitations
-
Gemini 4 Carbon Developer Guide: Google Cloud documentation
- Link:
docs.cloud.google.cn/gemini-enterprise-agent-platform/models/guides/gemini-4-carbon -
Notes: Thinking Level, parameter limits, and long decoding details
-
Official Eiffel Tower History: La tour Eiffel
- Link:
toureiffel.paris/en/the-monument/history - Notes: Component counts, number of drawings, construction timeline, and structural design background
Author: APIYI Technical Team
Technical Discussion: If you have questions about multi-agent orchestration or multimodal 3D generation, feel free to reach out through the APIYI apiyi.com homepage.