

Author’s note: Using three verifiable conversions, this article breaks down what the 1.7 GW, the theoretical annual energy output, and the deal value per MW in Anthropic’s gas-fired power equipment deal can and can’t tell us.
One-Line Summary: How to Read the Key Numbers in the 1.7 GW News
According to a November 8 Reuters report citing the Financial Times, Anthropic has reportedly committed about $3.4 billion to buy equipment involving 1.7 GW of gas-fired generating units. The two numbers in this story that are easiest to misread are “1.7 GW” and “$3.4 billion.”
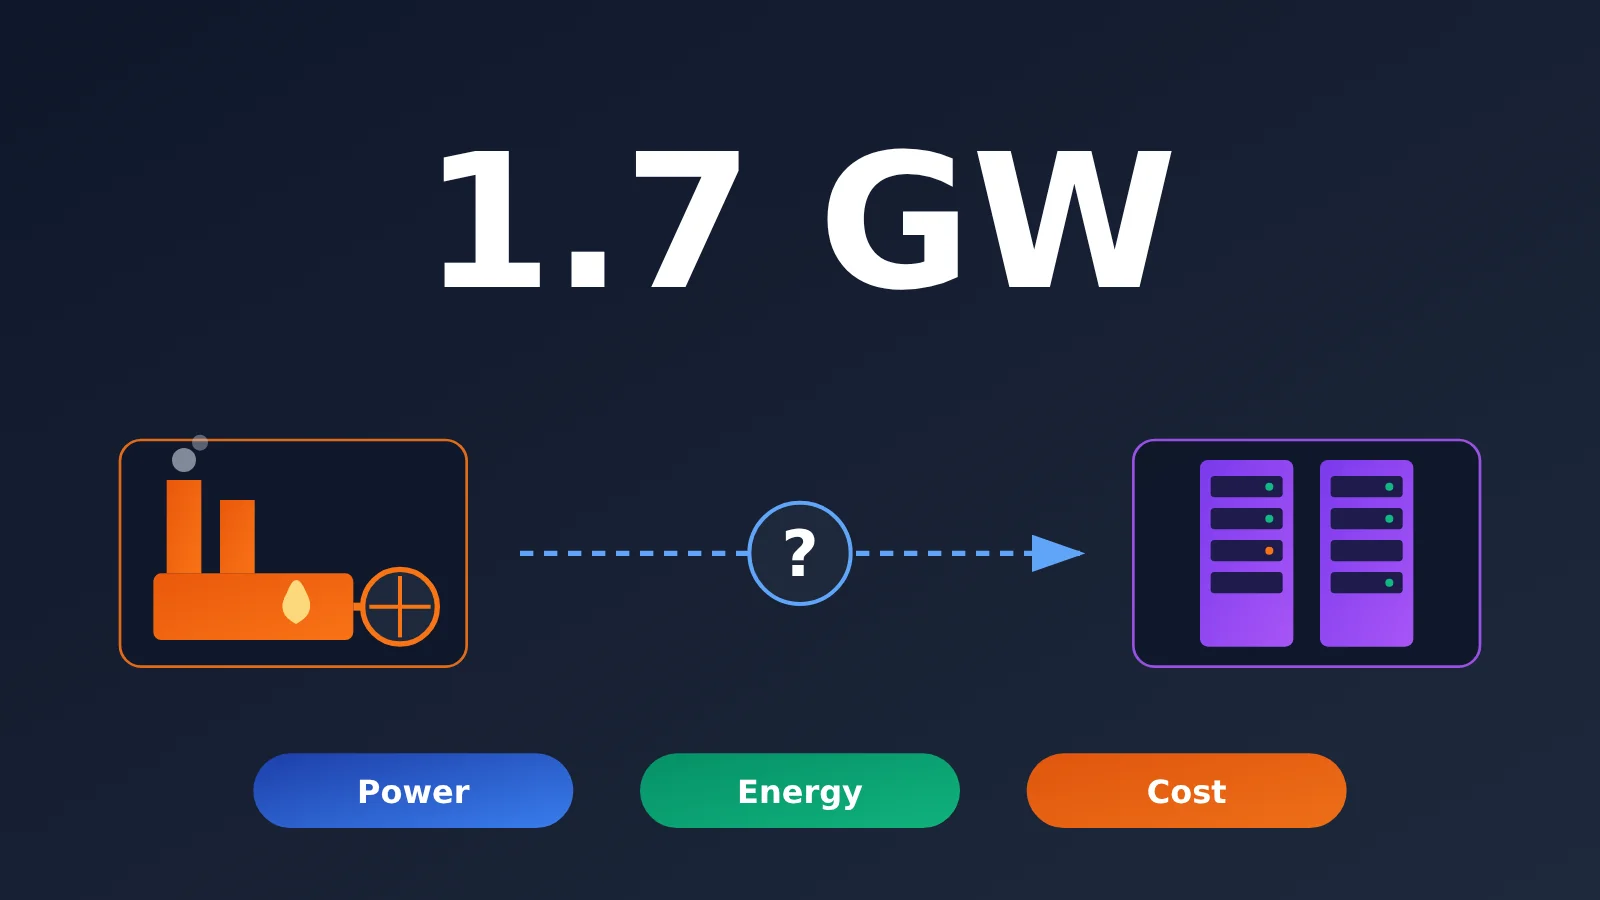
This isn’t an energy industry commentary, and it won’t judge whether the deal is a good one. It does just one thing: it uses unit conversions and clearly labeled teaching assumptions to explain three points. 1.7 GW is power, not energy. Generating capacity isn’t the same as power available to servers. And deal value per MW isn’t an electricity price.
Core value: After reading this, you’ll be able to use four questions to quickly judge what the numbers in any AI power story actually tell you.
In This Article: Five Layers of the 1.7 GW Power Figure
- 1.7 GW Is a Power Scale
- What Assumptions Turn Power into Annual Energy
- 2.1 The Theoretical 8,760-Hour Calculation
- 2.2 How Changes in Capacity Factor Affect the Result
- Why Generation Capacity Isn’t the Same as Usable Server Power
- Why Deal Value per MW Isn’t an Electricity Price
- How to Fact-Check AI Power News
Quick Reference: Units to Know Before Reading 1.7 GW
The table below underpins every conversion in this article. Power units and energy units look like they differ by just an “h”, but they mean very different things, and that’s the most common mix-up in electricity news.
| Term | Meaning | Conversion |
|---|---|---|
| kW (kilowatt) | Unit of power | 1 kW = 1,000 W |
| MW (megawatt) | Unit of power | 1 MW = 1,000 kW |
| GW (gigawatt) | Unit of power | 1 GW = 1,000 MW |
| kWh (kilowatt-hour) | Unit of energy, commonly called a “unit” of electricity | 1 kW sustained for 1 hour |
| TWh (terawatt-hour) | Unit of energy | 1 TWh = 1 billion kWh |
| Capacity factor | Actual energy produced ÷ the theoretical energy if running at full rated power continuously over the same period | Dimensionless ratio |
| PUE | Total data center facility energy ÷ IT equipment energy | Requires a consistent accounting boundary |
| Levelized cost of electricity (LCOE) | Cost per unit of electricity generated | Requires a clear cost scope and lifetime energy output |
1.7 GW Is a Power Capacity Figure: Let’s Get the Deal Facts Straight First
Before doing any conversions, let’s be clear about how much of the report can actually be confirmed. The table below separates what’s “reported” from what can be “independently verified.”
| Item | Details | Nature of Evidence |
|---|---|---|
| Buyer | Reportedly Anthropic | Reuters relaying the FT; Reuters said it couldn’t immediately verify independently |
| Seller | OnePWR Solutions of San Antonio, Texas | Same as above |
| Amount | About $3.4 billion | Deal advisor Piper Sandler lists a transaction of similar size on its page, but the buyer is only described as “a frontier AI lab” |
| Capacity | About 1.7 GW of heavy-duty gas turbine generating units | Appears only in media reports; not given on the advisor’s page |
| Deal timing | Reportedly late September, disclosed by media on November 8 | Advisor’s page lists September 2026 |
| Deal scope | Equipment purchase commitments plus the engineering and construction capacity needed for installation; no company acquired, no employees transferred | Media reports |
| Undisclosed | Installation site, delivery and commissioning dates, fuel arrangements, split between equipment and construction costs | — |
So the more accurate way to put it is this: it’s a generation equipment deal disclosed by the media, not an announcement that power is up and running. “Locking in power capacity” here means securing equipment and construction resources, not already having stable power delivery.
What Is 1.7 GW in kW?
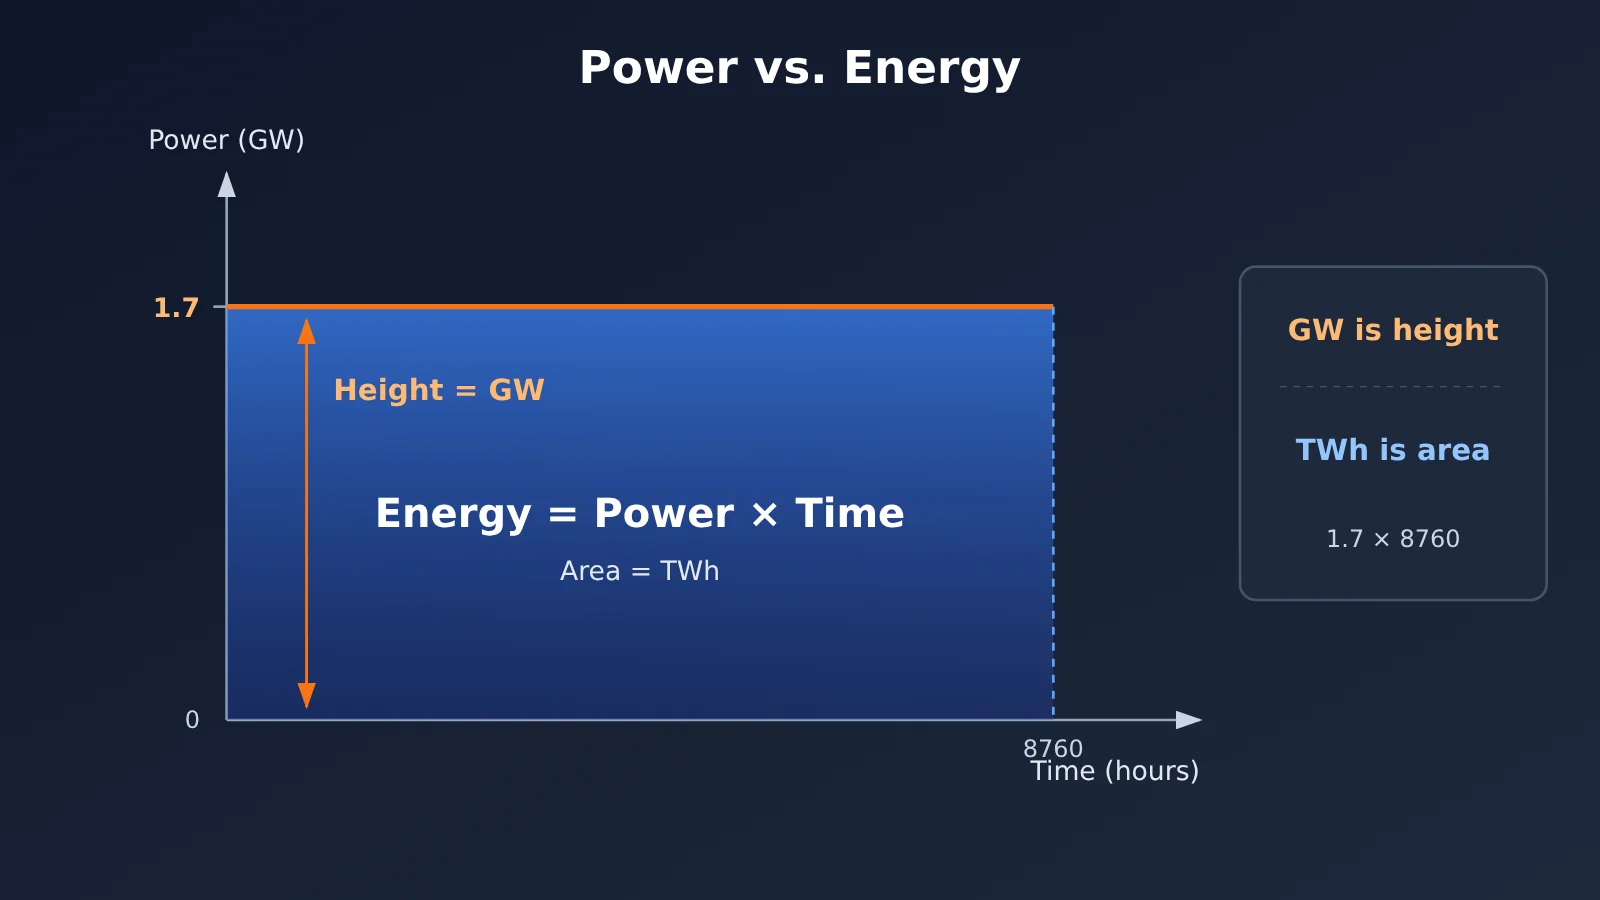
By the U.S. Energy Information Administration (EIA) unit definitions, 1.7 GW = 1,700 MW = 1.7 million kW. GW describes how much power a piece of equipment can output at a given moment under specific conditions, much like speed. Electricity (energy) is that power accumulated over time, like the distance you’ve traveled.
That’s why “generates 1.7 GW per year” is an incorrect expression. The right phrasing is “1.7 GW of generating capacity.” This article also deliberately avoids analogies like “equivalent to X cities” or “X nuclear plants,” because they lack a standard basis and bring in extra assumptions.
From 1.7 GW to Annual Electricity: What Assumptions Do You Need?
To turn power into energy, you have to multiply by time. The catch is that the reports don’t say when the units will be installed, how many hours a year they’ll run, or at what output level. So every number below is a teaching calculation by the author, not an operational forecast.
2.1 The Theoretical 8,760-Hour Calculation for 1.7 GW
A non-leap year has 365 × 24 = 8,760 hours. Suppose the 1.7 GW of equipment runs at full power every single hour of the year:
1.7 GW × 8,760 h = 14,892 GWh = 14.892 TWh ≈ 14.892 billion kWh
This number has exactly one purpose: explaining units. In reality, equipment gets delivered in batches, then installed and commissioned. It also goes through scheduled maintenance, and it faces derating and fuel supply constraints, so running at full power all year is almost never realistic.
2.2 How Capacity Factor Changes the Annual Electricity for 1.7 GW
The EIA defines capacity factor as the ratio of actual electricity generated over a period to the theoretical output if the plant had run at full power for that whole period. Note that it measures “how fully the equipment is used,” which is a different thing from thermal efficiency, the rate at which fuel gets converted into electricity.
Table: Teaching-assumption calculations of annual electricity for 1.7 GW (not a utilization forecast)
| Assumed capacity factor (for teaching) | Formula | Annual electricity |
|---|---|---|
| 50% | 1700 MW × 8760 h × 50% | 7.446 TWh |
| 80% | 1700 MW × 8760 h × 80% | 11.9136 TWh |
| 100% | 1700 MW × 8760 h × 100% | 14.892 TWh |
This table assumes all 1,700 MW is installed and ready to run for the entire non-leap year. It doesn’t account for mid-year deliveries, auxiliary power consumption, or differences in how capacity is measured. The gap between 50% and 100% is a factor of two, which shows how much the electricity output can differ for the same “1.7 GW,” depending on the operating level.
If the equipment only starts being delivered mid-year, the number of hours available to calculate shrinks, and first-year electricity will naturally be lower. Since neither the delivery dates nor the commissioning dates have been made public, this article doesn’t use them to forecast any first-year electricity figure.
Why 1.7 GW of Generation Capacity Isn’t the Same as Usable Server Power
Even if every generator unit is up and running, 1.7 GW doesn’t directly mean “1.7 GW available to power servers.” There are at least three layers in between: redundancy and maintenance, facility overhead energy, and measurement boundaries.
Understanding the Facility Overhead Behind 1.7 GW with PUE
ENERGY STAR defines PUE as the ratio of a data center’s total facility energy to the energy delivered to IT equipment. Within the same measurement boundary, the closer the number is to 1, the smaller the share of extra overhead from infrastructure like cooling and power distribution. PUE doesn’t measure the quality of model output, and it isn’t electricity use per token.
Here’s a teaching example unrelated to Anthropic that shows how the denominators differ:
| Item | Hypothetical Teaching Value | Notes |
|---|---|---|
| Total facility energy | 1.2 TWh | Same reporting period |
| IT equipment energy | 1.0 TWh | Same reporting period |
| PUE | 1.2 | 1.2 ÷ 1.0 |
| Non-IT energy | 0.2 TWh | 1.2 − 1.0 |
| Non-IT share of total facility energy | About 16.7% | 0.2 ÷ 1.2, not 20% |
“PUE is 20% above 1” means facility energy is 20% higher than IT energy, so the denominator is IT energy. “Non-IT accounts for 16.7%” uses total facility energy as the denominator. Both percentages are correct, but you can’t mix them up.
Redundancy Widens the Gap Further
Reliable power supply needs redundancy and maintenance scheduling. An IEA 2026 report analysis suggests that to provide reliable on-site gas-fired power for critical, fluctuating loads, generation infrastructure may need to be oversized by 30% to 70% relative to demand. That’s an industry research finding, and you shouldn’t apply it to this specific set of equipment to estimate usable IT capacity.
The takeaway is simple: procured nameplate capacity, actual power delivered, total facility energy, and IT energy are four different quantities, and they aren’t unconditionally interchangeable. Without site design, a redundancy plan, PUE, and hardware data, you also can’t convert 1.7 GW into a number of chips or a token throughput.
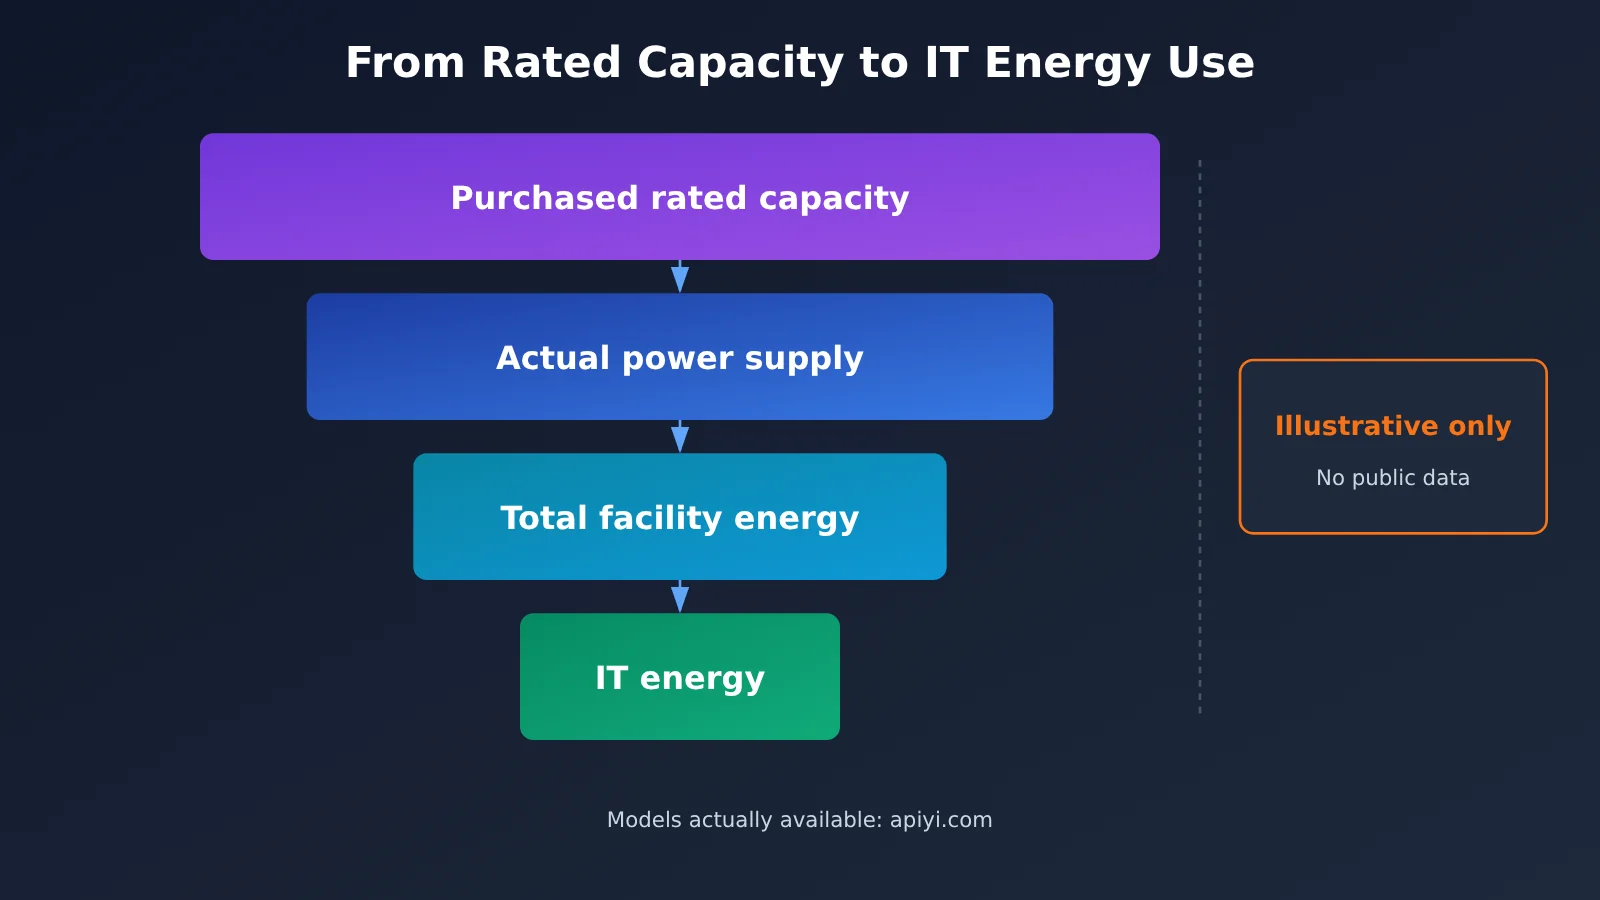
📌 About the diagram: The layer widths above are illustrative only and don’t represent real proportions. For API users, whether upstream capacity expansion actually shows up in the service should be judged by real invocation results. You can verify this yourself with the model list and small test calls on APIYI (apiyi.com).
Why the Dollars-per-MW Figure in the 1.7 GW Deal Isn’t an Electricity Price
If you divide the two reported approximate numbers, you get a ratio (calculated by the author):
$3.4 billion ÷ 1,700 MW ≈ $2 million/MW ≈ $2,000/kW
The unit of this ratio is “dollars per unit of power,” while electricity prices are measured in “dollars per unit of energy” (dollars/kWh). The dimensions are different, which means these two aren’t the same kind of number at all. The former answers “how much deal value corresponds to each 1 kW of equipment capacity,” while the latter answers “how much does it cost to generate one kilowatt-hour.”
What’s Missing Between the 1.7 GW Deal Value and a Per-kWh Cost
To get a complete cost per kWh, you’d need at least the following inputs, and the public materials don’t provide any of them:
- Fuel cost: one of the major long-term expenses for gas-fired units
- Operations and maintenance: overhauls, staffing, spare parts
- Financing cost: capital structure and interest rates
- Operating lifetime and lifetime energy output: how many years the equipment runs and how much electricity it actually generates
- Scope of costs: how the $3.4 billion splits between equipment and construction/engineering hasn’t been disclosed
Also, both the deal value and the capacity are approximations, so the result of dividing them should only be treated as an order-of-magnitude reference. It isn’t a vendor quote, and it isn’t the full cost of building a power plant. This article doesn’t judge whether the deal is expensive or cheap, and you can’t use it to work out how much energy each Claude request consumes or how much API prices should drop.
What the 1.7 GW News Means for Developers
Impact on API Users
Long-term infrastructure investment and your day-to-day API experience sit at different layers. Whether equipment gets delivered, whether it goes into operation, whether the compute hardware is in place, and how services are allocated all affect the final outcome. Right now, nothing suggests this deal has changed API pricing, quotas, latency, or stability.
A more practical approach is to rely on your own workload tests: check the currently available models, quotas, error rates, response latency, and your actual bill separately. The example below lists the models you can currently call through an OpenAI-compatible endpoint:
from openai import OpenAI

client = OpenAI(
    api_key="YOUR_API_KEY",
    base_url="https://api.apiyi.com/v1"  # APIYI unified endpoint, GET /v1/models
)

for m in client.models.list().data:
    print(m.id)
View the full check script (list models + measure latency)
import time
from openai import OpenAI

client = OpenAI(
    api_key="YOUR_API_KEY",
    base_url="https://api.apiyi.com/v1"  # APIYI OpenAI-compatible endpoint
)

def list_models(keyword: str = "claude") -> list[str]:
    """List model IDs that contain the keyword"""
    ids = [m.id for m in client.models.list().data]
    return [i for i in ids if keyword.lower() in i.lower()]

def probe_latency(model: str, rounds: int = 3) -> None:
    """Measure response latency and errors with a tiny request"""
    for i in range(rounds):
        start = time.time()
        try:
            client.chat.completions.create(
                model=model,
                messages=[{"role": "user", "content": "ping"}],
                max_tokens=5,
            )
            print(f"[{model}] 第{i+1}次 OK,耗时 {time.time()-start:.2f}s")
        except Exception as e:
            print(f"[{model}] 第{i+1}次 失败:{e}")

if __name__ == "__main__":
    candidates = list_models("claude")
    print("候选模型:", candidates)
    if candidates:
        probe_latency(candidates[0])  # Replace with the model ID you actually plan to use
🚀 Quick check tip: Upstream news about power and compute can’t tell you what your API calls will feel like today. Grab free test credits at APIYI (apiyi.com) and use the script above to run a small-scale latency and error-rate test on your target model. Keep in mind that the model list endpoint only reflects which models are callable at that moment. It’s not an availability guarantee.
Impact on the Industry
- The power supply chain is moving upstream: Assuming the reports are accurate, AI companies securing power generation equipment and engineering resources directly shows they’re investing more deeply in the power supply chain.
- There’s more than one bottleneck: The IEA points out that supply chains for gas turbines, transformers, advanced chips, and IT components are getting tighter, and grid connection and planning approvals are under strain too. Buying chips, getting power equipment, and completing a grid connection are separate construction requirements.
- On-site generation isn’t a shortcut: The IEA notes that many on-site natural gas generation projects in the US are still at an early stage, and the rapid swings in AI workloads create reliability challenges, which makes energy storage an important companion piece.
A Checklist for Reading AI Power News Like “1.7 GW”
Next time you see a headline like “Company X locks in X GW of power,” run it through the four questions in the table below, one at a time:
| Question to Check | Answer for This 1.7 GW Deal | Common Misreading |
|---|---|---|
| Is the number power or energy? | Power (equipment capacity) | Reading it as “1.7 GW generated per year” |
| Is the equipment contracted or in operation? | Reportedly a purchase commitment; no public commissioning date | Assuming the power is already being reliably delivered |
| What timing and utilization assumptions went into the calculation? | None given in the reports, so any annual energy figure requires your own assumptions | Treating 14.892 TWh as actual generation |
| Does the dollar amount cover the full scope of costs? | Equipment and engineering aren’t broken out, and fuel and O&M aren’t included | Treating $2,000/kW as an electricity price |
| Is there direct evidence about API services? | No evidence of price changes, quota changes, or performance changes | Concluding “it’ll be faster and cheaper right away” |
FAQ
Q1: How big is 1.7 GW, really?
1.7 GW equals 1,700 MW, or 1.7 million kW. It’s a measure of power. It describes how much the equipment can output at any given moment, not how much electricity it generates in a year, and it’s not a GPU compute metric either.
Q2: How much electricity can 1.7 GW produce in a year?
It depends on operating hours and capacity factor. Running at full power all year gives a theoretical 14.892 TWh; under a 50% illustrative assumption, it’s about 7.446 TWh. Since neither the commissioning date nor any operating data has been made public, any specific figure is just a back-of-the-envelope calculation.
Q3: Has the deal been confirmed?
The core information comes from Reuters relaying a Financial Times report, and Reuters said it couldn’t immediately verify it independently. A deal advisor’s page discloses a $3.4 billion OnePWR transaction from September 2026, but it doesn’t name the buyer and doesn’t mention the 1.7 GW figure.
Q4: Does $2,000 per kW tell us whether electricity is expensive or cheap?
No. It’s just the reported dollar amount divided by the approximate capacity, so the unit is $/kW, while electricity prices are quoted in $/kWh. Fuel, O&M, financing, and operating lifetime aren’t factored in at all.
Q5: Will this deal make the Claude API cheaper or faster?
Right now, no pricing announcement or performance benchmark supports that conclusion. It’s best to rely on your own testing. For example, you can use APIYI (apiyi.com) with an OpenAI-compatible interface to measure latency and error rates for Claude and other models, then check your bill to judge the actual cost.
Q6: As a developer, what should I do when I see news about upstream capacity expansion?
Treat expansion news as long-term background, and treat available models, quotas, and latency as the facts of the moment. If you need to compare and switch between multiple models, you can use APIYI (apiyi.com) to call models from several providers with a single key and benchmark them side by side with the same script, rather than basing decisions on capacity numbers from the news.
Key Takeaways: The 1.7 GW Power Deal
- Units first: 1.7 GW is power (capacity), equal to 1.7 million kW. It is not annual generation.
- Energy needs assumptions: Running at full power all year gives a theoretical 14.892 TWh. The real figure depends on when the plant goes live and its capacity factor.
- Capacity factor isn’t efficiency: It measures how heavily a plant is used, which is a different thing from the thermal efficiency of turning fuel into electricity.
- Generation capacity isn’t IT power: Redundancy, cooling, power distribution, and how PUE is counted can all widen the gap.
- A ratio isn’t an electricity price: A figure of about $2,000/kW has different units than $/kWh.
- Check it yourself: Real-world service experience is what counts. You can list models and measure latency through APIYI at apiyi.com.
Summary: Four Questions for Reading 1.7 GW
The key points from the 1.7 GW news:
- Power vs. energy: 1.7 GW describes the size of the equipment. To turn it into TWh, you have to state the time period and the capacity factor.
- Capacity vs. usable load: Rated generation capacity, actual power delivered, facility energy use, and IT energy use are four separate quantities. You can’t swap one for another.
- Dollar amount vs. cost: Dividing the deal value by capacity gives a ratio, not an electricity price. You can’t derive API pricing from it either.
When you read power news, start by asking: “Is this power or energy? Is it contracted or actually in operation? What assumptions were used? What does the dollar figure cover?” That clears up most misreadings. As for whether upstream capacity expansion actually improves the invocation experience, the best way to find out is to run a small test through APIYI at apiyi.com using the free quota, and let the data speak.
📚 References
- Reuters report (carried by CNA): Coverage of Anthropic’s power generation equipment deal
- Link:
channelnewsasia.com/business/anthropic-secures-34-billion-generator-deal-ai-data-centers-ft-reports-6534256 -
Note: Source for the deal’s value, capacity, and timing. The core details are relayed from the FT.
-
Piper Sandler OnePWR transaction disclosure: Primary page from the deal advisor
- Link:
pipersandler.com/investment-banking-transactions/onepwr-solutions-20260901 -
Note: Corroborates a deal of a similar size, but doesn’t disclose the buyer or the capacity.
-
OnePWR equipment inventory announcement: Supplier statement from February 2026
- Link:
globenewswire.com/news-release/2026/02/03/3231159/0/en/onepwr-solutions-announces-more-than-1-2-gw-of-power-generation-assets-ready-for-deployment.html -
Note: A statement about the supplier’s overall resources, not a confirmation of the deal.
-
EIA electricity measurement explainer: Definitions of power and energy units
- Link:
eia.gov/energyexplained/electricity/measuring-electricity.php -
Note: Authoritative explanations of units such as kW and kWh.
-
EIA capacity factor definition: Glossary entry
- Link:
eia.gov/tools/glossary/index.php?id=Capacity_factor -
Note: Defines capacity factor, which is distinct from thermal efficiency.
-
ENERGY STAR PUE explainer: Data center power distribution and PUE
- Link:
energystar.gov/products/data_center_equipment/16-more-ways-cut-energy-waste-data-center/reduce-energy-losses-power-distribution-units-pdus -
Note: Source for the PUE definition.
-
IEA 2026 Energy and AI report: Executive summary and press release
- Link:
iea.org/reports/key-questions-on-energy-and-ai/executive-summary - Note: Background on data center electricity use, supply chain bottlenecks, and on-site power generation.
Author: APIYI Technical Team
Get in touch: Visit the APIYI website at apiyi.com to contact us. For more API details, check out the documentation center at docs.apiyi.com.


