Author's Note: This article provides a detailed explanation of the working principles and usage of the five AI agents within the PaperBanana scientific drawing framework. Combined with the low-cost Nano Banana Pro API solution, it aims to help researchers efficiently generate high-quality figures for their papers.
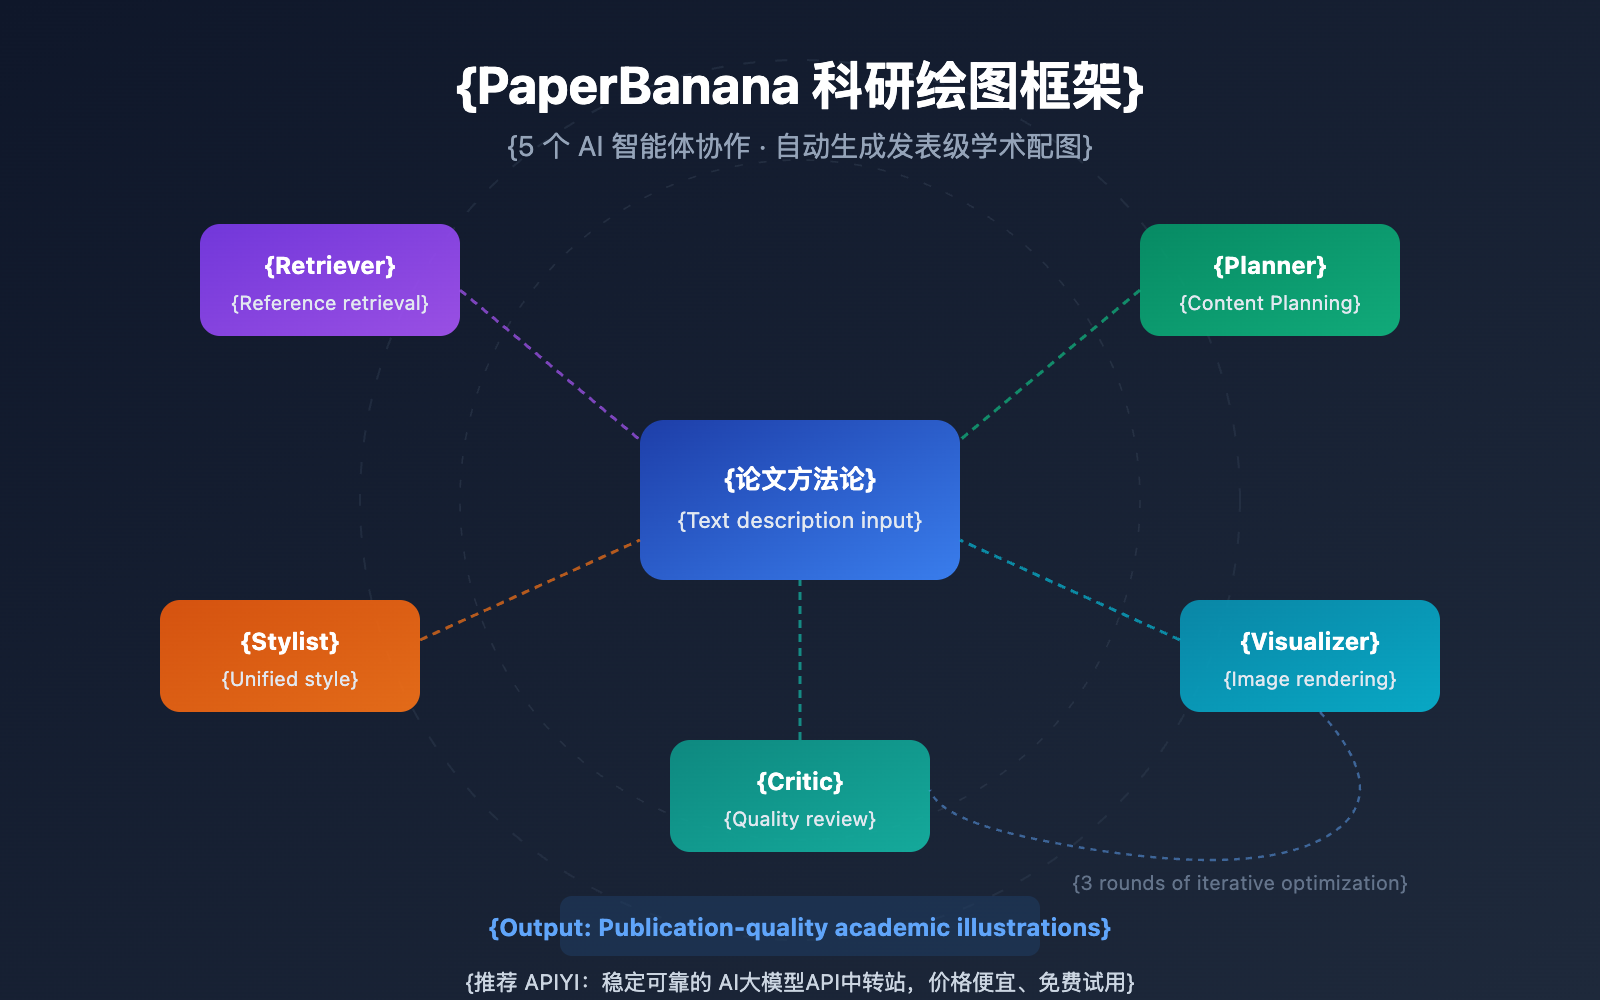
Methodology figures and statistical charts in scientific papers have always been one of the most time-consuming manual tasks for researchers. The PaperBanana scientific drawing framework was created specifically to address this pain point. Jointly developed by Peking University and Google Cloud AI Research, it uses 5 specialized AI agents working in collaboration to automatically transform text descriptions into publication-quality academic figures.
Core Value: By the end of this article, you'll master the complete workflow of PaperBanana, understand the division of labor among the five agents, and learn how to use the Nano Banana Pro API to generate high-quality academic figures at just 20% of the official cost.
Key Highlights of PaperBanana Scientific Drawing
| Point | Description | Value |
|---|---|---|
| 5-Agent Collaboration | Clear division of labor among Retriever, Planner, Stylist, Visualizer, and Critic | Specialized processing at each stage, with quality far exceeding single-model generation |
| 292 Benchmarks | Based on the PaperBananaBench using NeurIPS 2025 papers | 72.7% blind evaluation win rate, surpassing human baselines |
| Dual-Mode Output | Image generation for methodology figures; Matplotlib code for statistical charts | Completely eliminates numerical hallucination issues in data visualization |
| 3-Round Iterative Optimization | The Critic agent automatically detects errors and guides regeneration | Readability improved by 12.9%, aesthetics by 6.6% |
| Nano Banana Pro Driven | Rendering based on the Gemini 3 Pro Image model | Precise generation of shapes, connection lines, and scientific icons |
Deep Dive into PaperBanana's 5 Specialized Agents
The core of the PaperBanana scientific drawing framework lies in breaking down the complex task of academic figure generation into five independent, specialized agents. Each agent is responsible for a specific stage, collaborating to complete the entire process from text description to publication-quality figures. The advantage of this multi-agent architecture is that every step has a dedicated model for quality control, rather than relying on a single model to handle everything.
In practice, the five agents of PaperBanana work together in a two-phase process: "Linear Planning + Iterative Optimization." The first phase involves the Retriever, Planner, and Stylist, which handle reference retrieval, content planning, and style setting. The second phase enters a 3-round iterative loop between the Visualizer and Critic, gradually improving the figure's faithfulness, conciseness, readability, and aesthetics.
How PaperBanana's 5 Core Agents Work
Retriever Agent: Reference Retrieval
Retriever is where everything starts for PaperBanana. It searches a pre-built database for figure examples similar to your paper's content, using them as templates for planning and style. These references come from top-tier conference papers, ensuring the output meets high academic publishing standards.
Planner Agent: Content Planning
The Planner agent is responsible for turning your paper's methodology descriptions into a detailed visual plan. It uses In-Context Learning based on the examples found by the Retriever to deconstruct complex technical descriptions into a structured layout—covering element types, spatial relationships, connections, and information hierarchy.
Stylist Agent: Style Unification
The Stylist agent extracts academic style guides from the global reference examples. It makes sure the generated figures stay consistent in terms of color palettes, font choices, and icon styles. This is especially important when your paper has multiple figures—they all need to share a unified visual language.
Visualizer Agent: Image Rendering
The Visualizer is the heavy lifter in PaperBanana's framework. It uses the Nano Banana Pro (Gemini 3 Pro Image) model to render the optimized text descriptions into final images. It's great at accurately generating the complex elements you often see in research papers:
- Encoder-decoder frameworks in model architectures
- Conditional branches and loops in algorithm flowcharts
- Multi-module connections in system pipelines
- Specialized scientific icons and symbols
Critic Agent: Quality Review
The Critic agent automatically reviews the quality of the figures after each generation round. It evaluates them across four dimensions: content fidelity, information conciseness, visual readability, and aesthetics. It'll spot common issues like misaligned lines, incorrect arrow directions, or overlapping elements, and then provide suggestions for the Visualizer to improve in the next iteration.
| Agent | Responsibility | Input | Output |
|---|---|---|---|
| Retriever | Reference Retrieval | Methodology text | Set of similar figure examples |
| Planner | Content Planning | Text + Reference examples | Structured diagram plan |
| Stylist | Style Unification | Reference example set | Academic style guide |
| Visualizer | Image Rendering | Diagram plan + Style guide | Generated figure image |
| Critic | Quality Review | Generated figure + Original description | Revision suggestions and score |
🎯 Tech Tip: PaperBanana's Visualizer agent relies on the Nano Banana Pro model for rendering. If you want to use Nano Banana Pro independently for your own research drawing tests, you can access the model API via the APIYI (apiyi.com) platform. It's only $0.05 per image—about 80% cheaper than official pricing.
Supported Figure Types in PaperBanana
The PaperBanana framework supports two main categories of academic figures, using different technical approaches to ensure the best quality:
Methodology Diagrams
Methodology diagrams are the most common and complex illustrations in research papers. PaperBanana uses the Nano Banana Pro model to generate these images directly. Supported types include:
- Model Architectures: Visualizing classic structures like Transformers, CNNs, and GANs.
- Algorithm Flowcharts: Showing execution flows and conditional branches for multi-step algorithms.
- System Pipelines: Mapping out data flow and processing across multi-module systems.
- Encoder-Decoder Frameworks: Detailing the internal structure of sequence-to-sequence models.
Statistical Plots
For statistical charts that require precise numerical data, PaperBanana takes a different route. Instead of generating an image directly, it creates executable Python Matplotlib code. This approach completely eliminates "numerical hallucinations" common in AI image generation, ensuring every data point in your bar charts or line graphs is 100% accurate.
| Figure Type | Generation Method | Key Advantage | Best For |
|---|---|---|---|
| Model Architectures | Nano Banana Pro Image Gen | Precise rendering of complex structures | Methodology sections in DL papers |
| Algorithm Flowcharts | Nano Banana Pro Image Gen | Clear expression of conditional branches | Algorithm design papers |
| Bar/Line Charts | Matplotlib Code Gen | Zero numerical error | Presenting experimental results |
| System Pipelines | Nano Banana Pro Image Gen | Clear multi-module relationships | System design papers |
PaperBanana 科研绘图快速上手
极简示例:使用 Nano Banana Pro API 生成科研配图
以下是通过 API 调用 Nano Banana Pro 模型生成科研配图的最简方式:
import openai

client = openai.OpenAI(
    api_key="YOUR_API_KEY",
    base_url="https://vip.apiyi.com/v1"  # 使用 APIYI 统一接口
)

response = client.chat.completions.create(
    model="nano-banana-pro",
    messages=[{
        "role": "user",
        "content": "Generate a methodology diagram showing a Transformer encoder-decoder architecture with attention mechanism, suitable for an academic paper. Use clean lines, professional color scheme, and labeled components."
    }]
)
print(response.choices[0].message.content)
查看完整的 PaperBanana 风格科研配图生成代码
import openai
from typing import Optional

def generate_scientific_figure(
    description: str,
    style: str = "academic",
    diagram_type: str = "methodology",
    max_tokens: int = 4096
) -> str:
    """
    使用 Nano Banana Pro 生成科研配图

    Args:
        description: 配图内容描述(英文效果最佳)
        style: 风格类型 - academic/minimal/detailed
        diagram_type: 配图类型 - methodology/flowchart/architecture
        max_tokens: 最大输出 token 数

    Returns:
        生成的配图结果
    """
    client = openai.OpenAI(
        api_key="YOUR_API_KEY",
        base_url="https://vip.apiyi.com/v1"  # APIYI统一接口
    )

    style_prompts = {
        "academic": "professional academic paper style, clean layout, labeled components",
        "minimal": "minimalist style, essential elements only, high contrast",
        "detailed": "detailed illustration with annotations and legends"
    }

    prompt = f"""Generate a {diagram_type} diagram for a research paper:
{description}

Style requirements: {style_prompts.get(style, style_prompts['academic'])}
Output: High-resolution image suitable for publication."""

    try:
        response = client.chat.completions.create(
            model="nano-banana-pro",
            messages=[{"role": "user", "content": prompt}],
            max_tokens=max_tokens
        )
        return response.choices[0].message.content
    except Exception as e:
        return f"Error: {str(e)}"

# 使用示例:生成 Transformer 架构图
result = generate_scientific_figure(
    description="A Vision Transformer (ViT) architecture showing patch embedding, "
                "multi-head self-attention blocks, and classification head. "
                "Include skip connections and layer normalization.",
    style="academic",
    diagram_type="architecture"
)
print(result)
💰 成本优化: 通过 APIYI apiyi.com 调用 Nano Banana Pro API,每张科研配图仅需 $0.05,相比官方 $0.234 的定价节省近 80%。对于需要批量生成配图的科研团队,这一价格优势尤为显著。同时推荐使用在线出图工具 Image.apiyi.com,无需代码即可快速生成科研插图。
PaperBanana 科研绘图评测数据
PaperBanana 科研绘图框架在 PaperBananaBench 基准测试中表现优异。该基准包含 292 个测试用例,全部来源于 NeurIPS 2025 发表的论文配图,覆盖了多样化的研究领域和插图风格。
核心评测指标
| 评测维度 | PaperBanana 表现 | 相比基线提升 | 说明 |
|---|---|---|---|
| 盲评胜率 | 72.7% | — | 人类评审在盲测中优选 PaperBanana 输出 |
| 简洁度 | 显著提升 | +37.2% | 去除冗余元素,信息密度更高 |
| 可读性 | 显著提升 | +12.9% | 布局清晰,信息层次分明 |
| 美观度 | 显著提升 | +6.6% | 配色和排版更专业 |
| 内容忠实度 | 45.8% | +2.8% | 仍低于 50% 人工基线,有改进空间 |
当前局限性
尽管 PaperBanana 科研绘图在自动化学术配图领域取得了突破性进展,但仍存在一些需要注意的局限:
- 输出格式: 当前仅支持栅格图像(PNG/JPG),不支持可编辑的矢量图形(SVG/PDF)
- 空间关系: 语言模型在检测连接线方向、箭头对齐等空间关系错误时存在困难
- 微调修正: 生成后无法对配图进行局部修改,需要重新生成整张图
- 内容忠实度: 45.8% 的忠实度得分说明复杂配图仍建议人工审核
🎯 实用建议: 对于重要论文的配图,建议使用 PaperBanana 生成多个版本后人工筛选。通过 APIYI apiyi.com 平台调用 Nano Banana Pro,可以低成本批量生成候选配图,大幅缩短筛选周期。
Nano Banana Pro Scientific Illustration Pricing Comparison
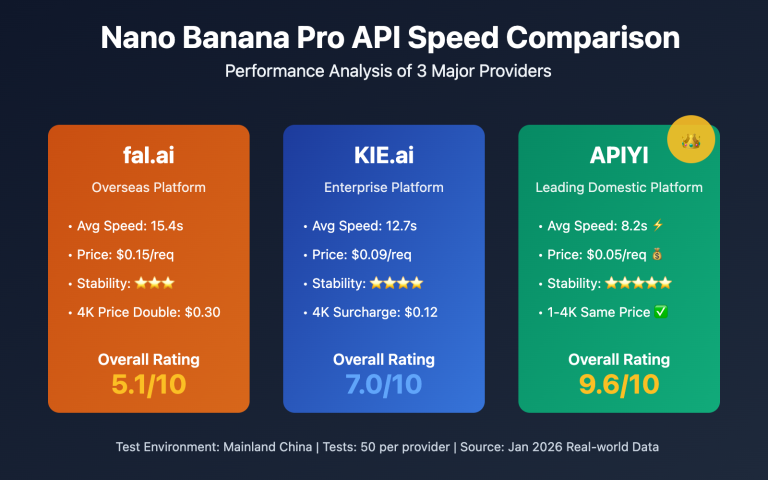
Nano Banana Pro is the underlying image generation model for PaperBanana scientific illustration. When using this model independently to generate scientific figures, you'll notice significant price differences across various platforms:
| Platform | Standard Resolution Price | 4K Resolution Price | Best For |
|---|---|---|---|
| Official Google API | $0.134/image | $0.234/image | Enterprise-level direct connection needs |
| APIYI (apiyi.com) | $0.05/image | $0.05/image | Research teams and individual developers (Recommended) |
| Google Pro Subscription | ~$0.007/image (at full usage) | ~$0.007/image | High-frequency users ($19.99/mo) |
By calling the Nano Banana Pro API through the APIYI platform, you're not just getting it for about 20% of the official price—it also supports OpenAI-compatible interface formats. This means you can switch over without having to rewrite your existing code. For research teams, this keeps the cost of batch-generating paper illustrations extremely low.
FAQ
Q1: Is PaperBanana scientific illustration currently open-source and available?
The PaperBanana paper (arXiv: 2601.23265) and project homepage are already public, and the code repository is located on GitHub at github.com/dwzhu-pku/PaperBanana. Right now, the code and datasets are being prepared for release. While you're waiting for the open-source version, you can jump straight into generating scientific figures using the Nano Banana Pro API, which is easily accessible via the APIYI (apiyi.com) platform.
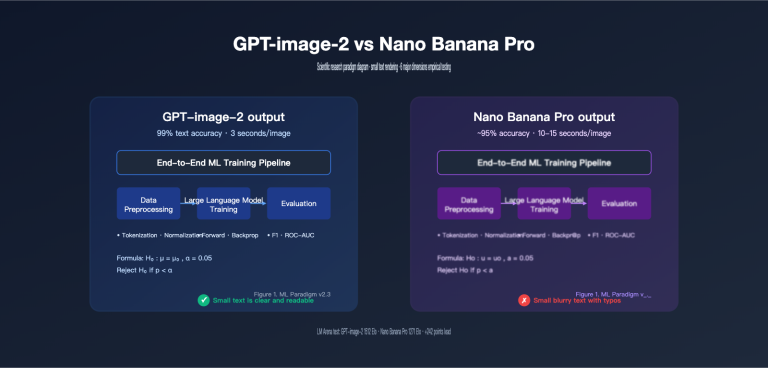
Q2: How’s the quality of the scientific illustrations generated by Nano Banana Pro?
Nano Banana Pro (Gemini 3 Pro Image) performs exceptionally well in scientific illustration scenarios. It supports high-resolution (up to 4K) output and can accurately render complex model architectures, flowcharts, and scientific icons. In PaperBanana's evaluations, human reviewers preferred this system's output 72.7% of the time. We recommend using English prompts to get the best results. If you want a no-code experience, the online tool Image.apiyi.com offers a visual interface that's great for quickly verifying how your figures will look.
Q3: How can I quickly get started with Nano Banana Pro for scientific illustrations?
Here's the fastest way to get up and running:
- Head over to APIYI (apiyi.com) to register an account and grab your API Key and some free credits.
- Use the code examples provided in this article—just swap in your API Key and you're good to go.
- Or, simply use the online tool at Image.apiyi.com if you don't want to write any code.
- We suggest starting with a simple architecture diagram to test the waters before moving on to complex, multi-module system diagrams.
Summary
Key takeaways of the PaperBanana scientific illustration framework:
- 5-Agent Architecture: Retriever, Planner, Stylist, Visualizer, and Critic work together to automate the process from text to academic illustrations.
- Dual-Mode Output: Methodology diagrams are generated via Nano Banana Pro, while statistical charts use Matplotlib code. This completely eliminates numerical hallucinations.
- Leading Performance: Achieved a 72.7% win rate in blind evaluations and a 37.2% improvement in conciseness, though content faithfulness still requires manual oversight.
- Cost-Effective Solution: Access the Nano Banana Pro API via the APIYI platform for just $0.05 per illustration—that's 80% cheaper than official pricing.
PaperBanana represents a major step forward in AI-assisted research. While fully automated academic illustrations still need to overcome bottlenecks in spatial relationship understanding, it's already significantly cutting down the time researchers spend on visuals.
We recommend trying out Nano Banana Pro's scientific plotting capabilities via APIYI (apiyi.com). The platform offers free credits and an OpenAI-compatible interface. You can also use the online tool at Image.apiyi.com for zero-code image generation.
📚 References
⚠️ Link Format Note: All external links use the
Resource Name: domain.comformat. This makes them easy to copy while avoiding SEO juice leakage from clickable links.
-
PaperBanana Project Homepage: Official release page containing the paper abstract, example illustrations, and a demo.
- Link:
dwzhu-pku.github.io/PaperBanana/ - Note: Explore the core capabilities and latest progress of the PaperBanana framework.
- Link:
-
PaperBanana GitHub Repository: Open-source code and datasets.
- Link:
github.com/dwzhu-pku/PaperBanana - Note: Access the PaperBanana source code and the PaperBananaBench evaluation benchmark.
- Link:
-
PaperBanana Paper: Full text of the arXiv preprint.
- Link:
arxiv.org/abs/2601.23265 - Note: Dive deep into the 5-agent architecture design and evaluation methodology.
- Link:
-
Nano Banana Pro Official Documentation: Google DeepMind model introduction.
- Link:
deepmind.google/models/gemini-image/pro/ - Note: Learn about Nano Banana Pro's technical specifications and API parameters.
- Link:
-
APIYI Nano Banana Pro Online Generation: A zero-code tool for generating scientific illustrations.
- Link:
Image.apiyi.com - Note: Generate scientific visuals directly in your browser without writing any code.
- Link:
Author: APIYI Team
Technical Discussion: Feel free to share your experience using PaperBanana for scientific plotting in the comments. For more AI model news, visit the APIYI technical community at apiyi.com.