
Author’s note: The “5% cost” figure for MAI Code 2 comes from a specific set of benchmarks combined with promotional pricing. This article pulls apart the original wording, the price sheet, and the arithmetic so you can estimate what your own bill will actually look like.
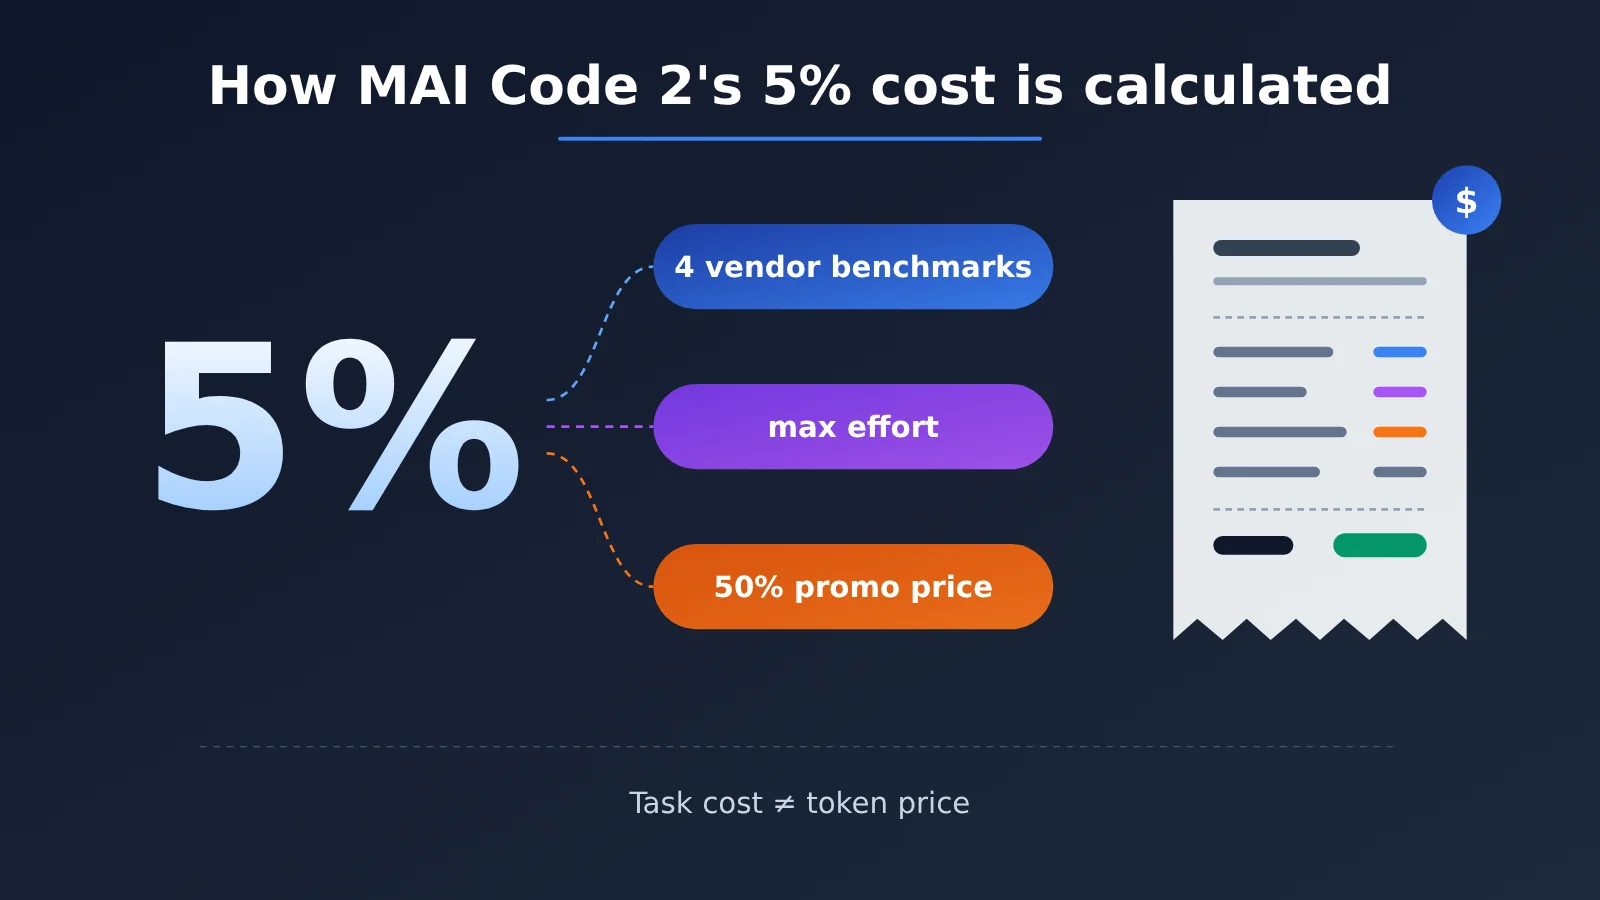
Short answer: MAI Code 2’s “5% cost” does not mean “a permanent 95% saving on every coding task.” It’s an average that Microsoft arrived at by comparing MAI Code 2 against Opus 5.5 across 4 coding benchmarks under the max effort setting — and the MAI side was priced at a 50% promotional discount. What that number tells you is “how much it cost to complete the same tasks in these specific benchmarks,” not “the per-token price is one-twentieth of the competitor’s.” Once the promotion ends, and once you swap in your own codebase and workflow, the ratio will shift and you’ll need to run the numbers again.
What you’ll take away from this article:
- The exact wording behind Microsoft’s “96% of the performance at 5% of the cost,” and the test conditions it depends on.
- GitHub Copilot’s published promotional pricing, regular pricing, and restoration dates for MAI Code 2 and MAI Code 2 Flash.
- Why “cost per task ratio” and “cost per token ratio” are not interchangeable.
- A reproducible fixed-token worked example, plus how caching, retries, and human rework change the bill.
- A procurement framework for evaluating coding models on cost per successful task.
Index: Part One, “The Facts,” walks through the release claim (1.1), the conditions of the four benchmarks (1.2), the Copilot price sheet (1.3), the promotion window (1.4), and the distinction between the two cost concepts (1.5) — sourced information only. Part Two, “Analysis and Judgment,” is our editorial math and interpretation: a fixed-token worked example first (2.1), then a projection of how the ratio shifts after the promotion ends (2.2), then a breakdown of caching, retries, and rework (2.3), and finally a checklist for buying on a cost-per-successful-task basis (2.4) and a few things to watch going forward (2.5). The cost projections in Part Two are original worked examples built on the official data cited above — they are not measured bills.
To Know: The Concepts Behind MAI Code 2 Costs
| Concept | Quick explanation |
|---|---|
| MAI Code 2 / MAI Code 2 Flash | Two coding models Microsoft released on November 17, 2026; Flash is positioned as lighter and cheaper per unit |
| Opus 5.5 | The model Microsoft used as the comparison baseline in its announcement |
| max effort | The highest reasoning-effort tier used during evaluation, which usually means more reasoning and token consumption |
| DeepSWE 1.1, TerminalBench 2.1, SWEAtlas, FrontierCode 1.1 | The four coding benchmarks Microsoft selected |
| MSBench | Microsoft’s internal evaluation framework, where the first three benchmarks run |
| subagent | An agent spawned by the main agent to handle subtasks; the first three benchmarks explicitly do not use one |
| cached input | Recurring input tokens that can hit the cache, priced far below regular input |
| AI credit | GitHub Copilot’s billing unit; 1 AI credit = $0.01 |
| task cost | The total cost actually spent completing a task, determined by unit price × usage × number of attempts |
| token unit price | The listed price per million input or output tokens—just one factor in task cost |
MAI Code 2 “5% Cost” Impact at a Glance
- Developers using GitHub Copilot: During the promo period, MAI Code 2 burns less AI credit, which makes it a good candidate for comparison testing in your own repos. Just remember the promo pricing has an end date—don’t treat promo-period bills as your long-term budget.
- Team leads and procurement folks: “5%” is a signal worth watching, but you can’t drop it straight into a cost model. Calculate cost per “successful task” based on your own task success rate, retry counts, and human review time.
- Developers invoking models through other channels: The pricing in this article is GitHub Copilot’s rate and doesn’t represent Azure AI Foundry or any other API channel. If you’re testing coding models on an aggregation platform like APIYI apiyi.com, check which models the platform actually supports and how it bills before you start.
- Researchers following benchmarks: 3 of the 4 benchmarks ran on Microsoft’s internal framework, which makes them vendor benchmarks—you’ll want to wait for independent reproduction.
1. The Facts: Where MAI Code 2’s “5% Cost” Comes From and What It Actually Quotes
1.1 MAI Code 2 Release and the Original “96% Performance, 5% Cost” Wording
Microsoft released MAI Code 2 and MAI Code 2 Flash on November 17, 2026. The release post claims that, averaged across four benchmarks, MAI Code 2 hits about 96% of Opus 5.5’s performance at roughly 5% of the cost.
That wording is the vendor’s own conclusion drawn from benchmarks it selected itself — it describes results on those four benchmarks, not a blanket verdict on general coding ability. The release post also notes that the MAI-side cost was calculated using a 50% promotional price.
1.2 The Four Benchmarks and Test Conditions for MAI Code 2
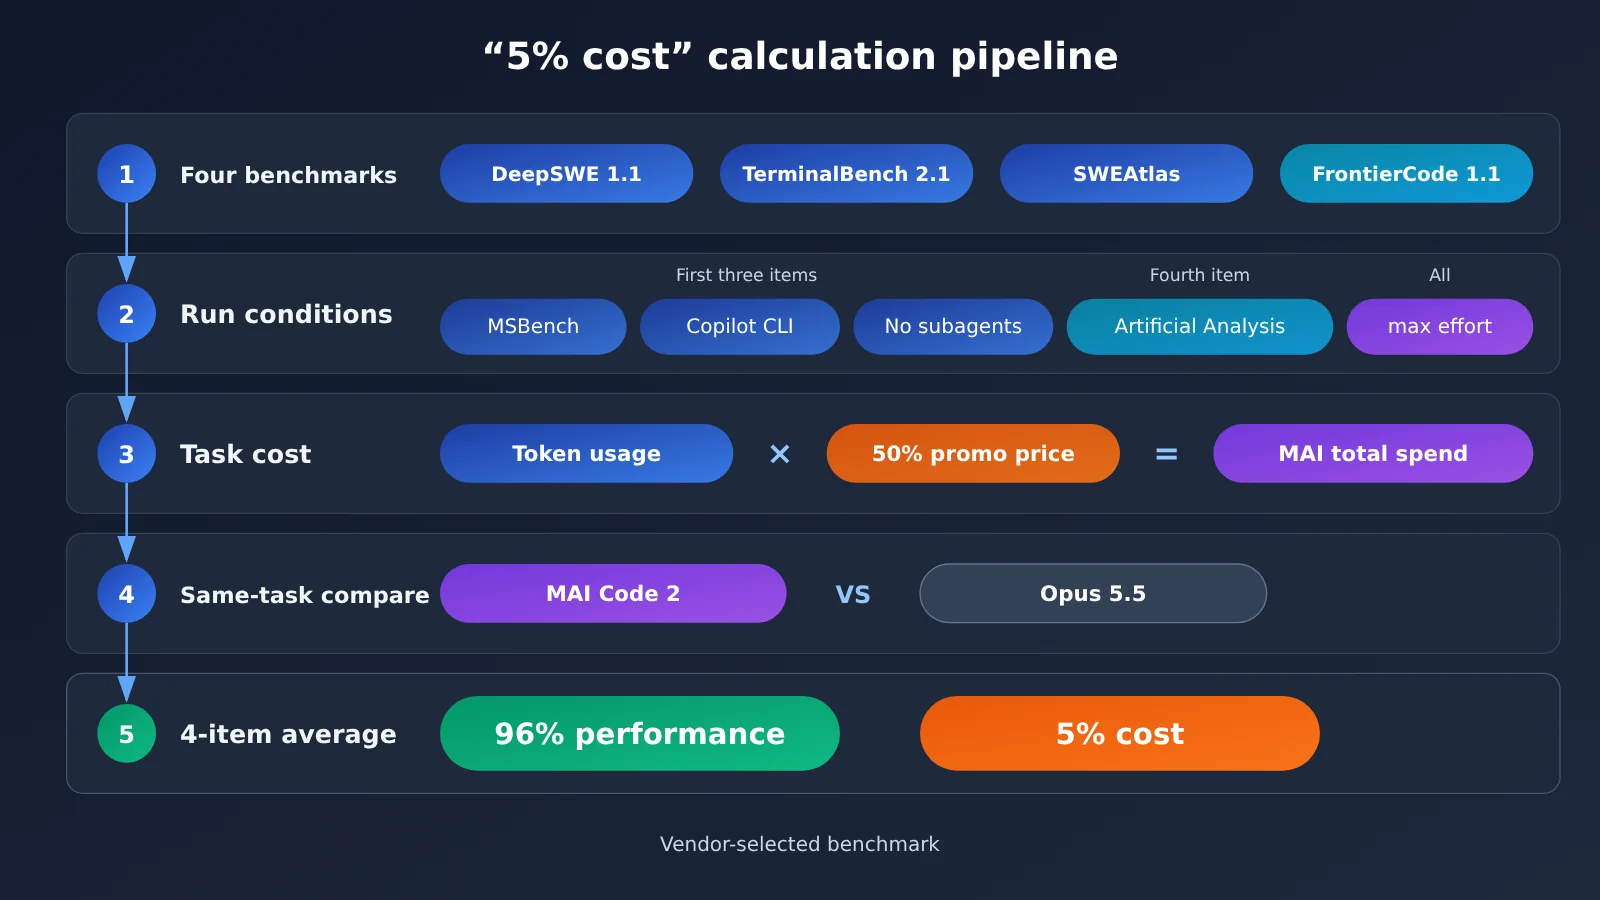
The four benchmarks that went into the average, and the conditions under which they ran, are listed below — all disclosed in the release post:
- DeepSWE 1.1, TerminalBench 2.1, SWEAtlas: run inside Microsoft’s internal MSBench, paired with Copilot CLI, with no subagents.
- FrontierCode 1.1: results sourced from Artificial Analysis.
- Reasoning effort: max effort.
- Cost basis: MAI model costs calculated at the 50% promotional price.
Together, these conditions determine the “96%” and “5%” numbers. Switch the reasoning effort, swap the agent framework, or turn on subagents, and both token usage and success rate can come out different.
1.3 MAI Code 2 Pricing in GitHub Copilot
GitHub’s official docs list the rates for the two models in Copilot, in USD per million tokens:
| Model | Pricing type | Input | Cached input | Output |
|---|---|---|---|---|
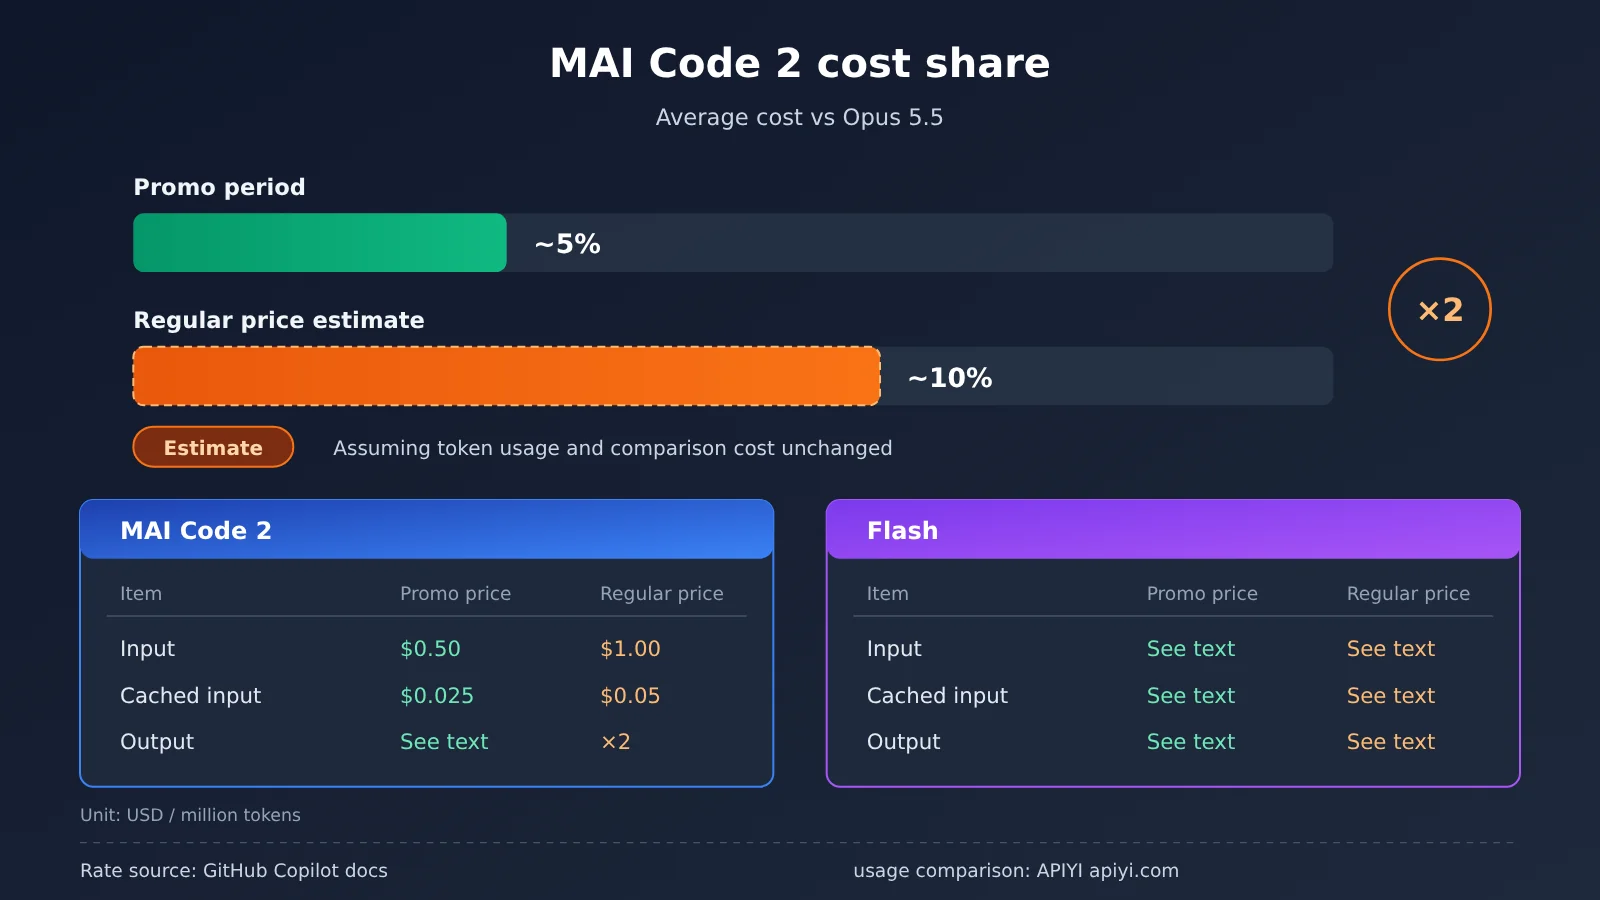
| MAI Code 2 | Promotional | 0.50 | 0.025 | 2.50 |
| MAI Code 2 | Regular | 1.00 | 0.05 | 5.00 |
| MAI Code 2 Flash | Promotional | 0.05 | 0.005 | 0.25 |
| MAI Code 2 Flash | Regular | 0.10 | 0.01 | 0.50 |
Two things to keep in mind: these are GitHub Copilot rates. Copilot bills in AI credits, and 1 AI credit equals $0.01. They aren’t Azure AI Foundry prices, and they don’t represent pricing across every API channel. The same doc also lists Opus 5.5 pricing, but unit prices alone can’t reconstruct the task-cost ratios from Microsoft’s evaluation. Keep Copilot’s included plan quota separate from overage charges: the dollar amounts here are usage value calculated from token rates, not necessarily additional charges. For older annual request-based plans, you should also check their specific multiplier rules.
1.4 How Long the MAI Code 2 Promotional Price Lasts
GitHub’s docs say regular pricing resumes on May 17, 2027. The docs don’t specify a time zone, so you can’t assume the promotional price still applies on May 17 itself. Don’t work out a specific Beijing-time cutoff on your own. As the switch date approaches, check GitHub’s current billing rules first. To keep your budget conservative, you can reserve regular pricing for usage that crosses that date.
1.5 Task Cost and Token Unit Price for MAI Code 2 Are Two Different Things
The “5% cost” figure compares the total spend required to complete an evaluation task. It equals the unit price multiplied by the actual tokens consumed, then summed across all steps. When two models solve the same problem, the number of input and output tokens they consume can differ substantially.
So, from “task cost is about 5%” you can’t infer that “the per-token price is 5% of the other model’s,” and the reverse doesn’t hold either. This is an editorial clarification of the two billing measures.
II. Analysis: How to Break Down the Actual Task Bill for MAI Code 2
The following is editorial analysis. All worked examples are original calculations based on publicly listed rates and rely on explicit assumptions. They are not measured bills, and are not backed by screenshots or actual invocation records.
2.1 MAI Code 2 Fixed-Token Worked Example
Suppose a task consumes a fixed 100,000 ordinary input tokens + 10,000 output tokens, with no caching, no retries, and excluding tool calls and subscription fees. Using the rates from Section 1.3:
- MAI Code 2 promo price: 100,000 × 0.50 / 1,000,000 + 10,000 × 2.50 / 1,000,000 = 0.05 + 0.025 = $0.075
- MAI Code 2 regular price: 0.10 + 0.05 = $0.15
- MAI Code 2 Flash promo price: 0.005 + 0.0025 = $0.0075
- MAI Code 2 Flash regular price: 0.01 + 0.005 = $0.015
| Model and Price | Input Cost | Output Cost | Total per Run | AI Credits Equivalent |
|---|---|---|---|---|
| MAI Code 2 promo | $0.05 | $0.025 | $0.075 | 7.5 |
| MAI Code 2 regular | $0.10 | $0.05 | $0.15 | 15 |
| Flash promo | $0.005 | $0.0025 | $0.0075 | 0.75 |
| Flash regular | $0.01 | $0.005 | $0.015 | 1.5 |
This table only shows the price difference “at the same usage volume.” In real tasks, the two models don’t consume the same number of tokens or achieve the same success rate. In this worked example, Flash costs 1/10 of Code 2 — that is, 90% less — but that doesn’t mean it will only cost 1/10 to actually complete the same task.
The script below only does local arithmetic and doesn’t call any model. input_tokens means total input including cached tokens, and cached_tokens is the portion of that which hit the cache; for output you should use the full billable output volume reported by the channel. Don’t plug usage from other API channels directly into Copilot rates and treat that as your real bill.
# USD per million tokens, source: GitHub Copilot rate table (for estimation reference only)
RATES = {
    "mai-code-2-promo":   {"input": 0.50, "cached": 0.025, "output": 2.50},
    "mai-code-2-regular": {"input": 1.00, "cached": 0.05,  "output": 5.00},
    "flash-promo":        {"input": 0.05, "cached": 0.005, "output": 0.25},
    "flash-regular":      {"input": 0.10, "cached": 0.01,  "output": 0.50},
}

def estimate_cost(rate_key, input_tokens, output_tokens, cached_tokens=0):
    r = RATES[rate_key]
    if not 0 <= cached_tokens <= input_tokens or output_tokens < 0:
        raise ValueError("token 数必须非负,且缓存量不能超过总输入")
    normal = input_tokens - cached_tokens
    return (normal * r["input"] + cached_tokens * r["cached"]
            + output_tokens * r["output"]) / 1_000_000

print(estimate_cost("mai-code-2-promo", 100_000, 10_000))  # 0.075

print(estimate_cost("mai-code-2-promo", 100_000, 10_000, 80_000))  # 0.037
🎯 Technical tip: When estimating costs, the most valuable data you have is the
usagerecords from your own tasks. You can use the same key on APIYI apiyi.com to run the same batch of tasks across several coding models, then total up the token usage and apply each channel’s actual per-unit price. Note that whether MAI Code 2 can be called on that platform depends on the platform’s model list.
2.2 What “5%” Might Become After the MAI Code 2 Promotion Ends
This section is an estimate, not official data. MAI Code 2’s regular price is exactly 2x the promotional price across all three items: input, cached input, and output. So under Copilot’s rate structure, and assuming token usage stays the same across categories, only these three token costs would double; the full task cost, including subscription, tools, labor, and so on, wouldn’t necessarily double.
If Opus 5.5’s cost basis stays the same, then the roughly 5% calculated at promotional prices would become about 10% at regular prices. Even if the “average” is the average of item-by-item ratios, each item doubles, so the average doubles too. It’s still a very low share, but it’s no longer the number in the headline.
2.3 Caching, Retries, and Manual Rework in Real MAI Code 2 Bills
The fixed-token examples are simplified cases designed for rate comparison. Real bills are affected by at least three additional factors.
Caching lowers costs. Continuing with the assumptions from 2.1, if 80,000 of the 100,000 input tokens hit the cache, the input cost at MAI Code 2’s promotional price becomes 20,000 × 0.50 / 1,000,000 + 80,000 × 0.025 / 1,000,000 = $0.012, plus $0.025 for output, for a total of about $0.037 per run—roughly half the $0.075 without caching. Agentic coding repeatedly reads the same repository context, so the cache hit rate can significantly affect input cost, but its share of total cost still depends on output and other fees.
Retries increase costs. Under the simplified assumptions that each attempt costs the same, success probability is fixed, and attempts are independent: expected model cost per successful task ≈ cost per attempt ÷ success rate. If a single attempt costs $0.075 and the success rate is 50%, the average cost per successful task is about $0.15. Even if another model has a 90% success rate, you must combine that with its per-attempt cost to compare—success rate alone doesn’t prove it’s cheaper. Success rates can only come from your own tests; this article doesn’t give success-rate numbers for any model.
Manual rework should be accounted for separately. The time engineers spend reviewing, editing, and rolling back code doesn’t show up in the token bill, and it can exceed model fees. There are also tool calls, CI runs, subscriptions, and other fixed or variable costs; official announcements haven’t fully disclosed how these are included, so you can’t treat “5%” as a rate that bundles all of these costs together.
| Cost factor | Impact on the bill | Included in “5%”? | How to obtain |
|---|---|---|---|
| Token unit price | Sets the baseline | Yes (promotional price) | Provider rate sheet |
| Token usage per task | Can go either way | Yes (under benchmark conditions) | usage field |
| Cache hit rate | Lowers | Depends on the benchmark run | Log statistics |
| Retries and failed tasks | Raises | Uncertain | Your own task success rate |
| Manual review and rework | Raises | Full accounting method not disclosed | Time tracking records |
| Tool calls and subscription fees | Raises | Full accounting method not disclosed | Invoices and contracts |
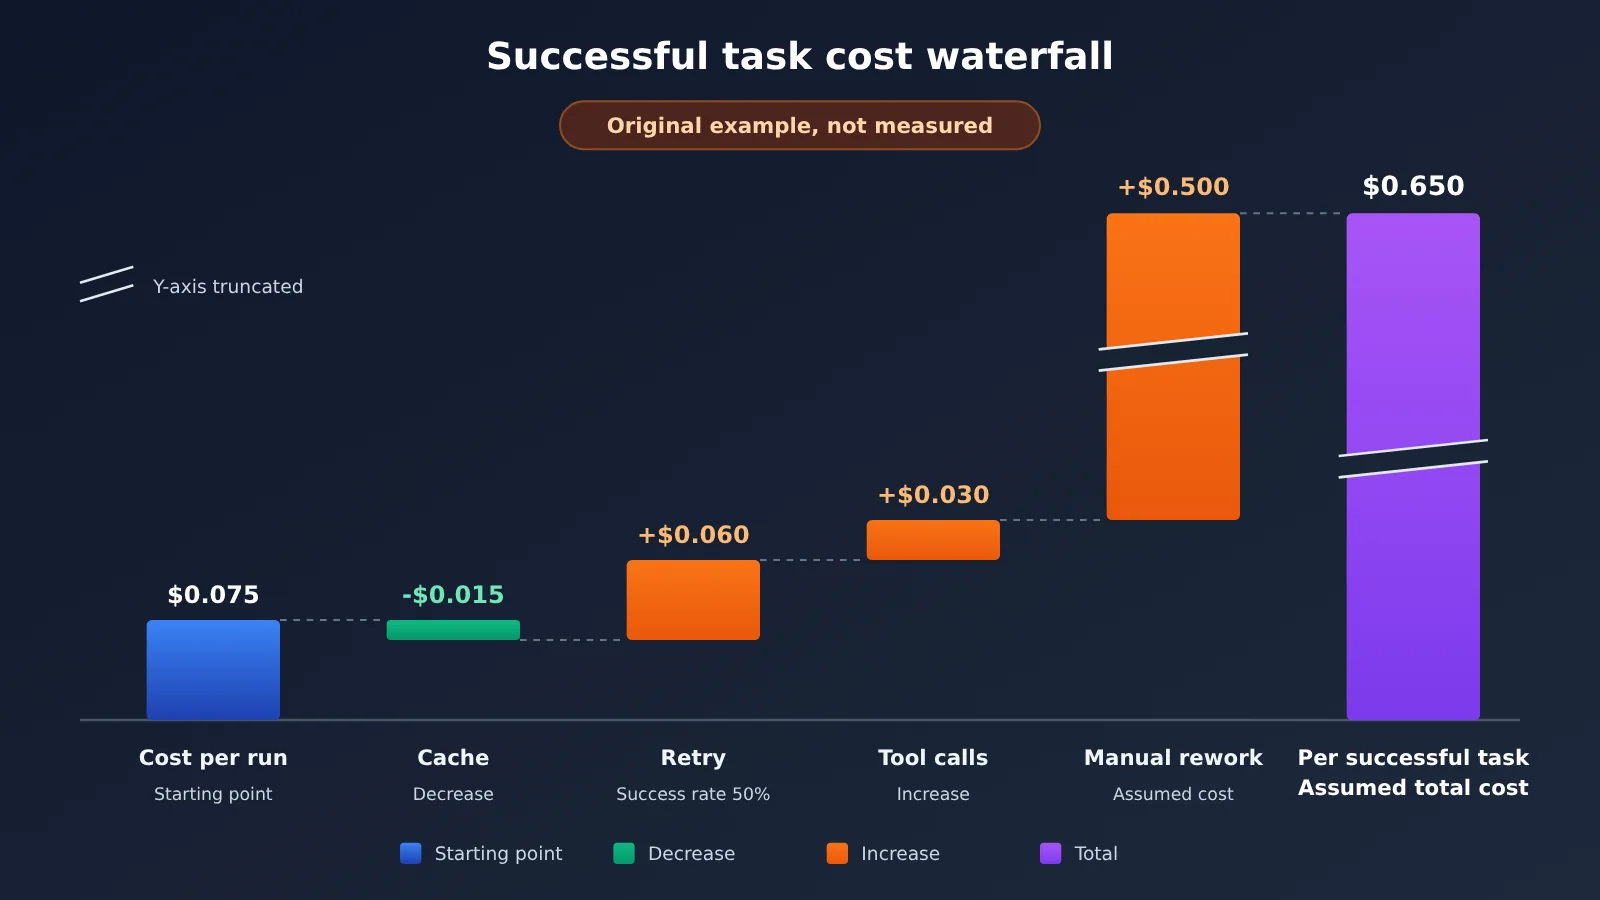
The figure below is another independent hypothetical example, not the 80,000-cache scenario above: assume caching reduces each $0.075 by $0.015 to $0.060; under independent attempts and a fixed 50% success rate, the expected model cost is $0.120; then assume $0.030 in tool fees and $0.500 in manual labor per successful task, for a total of $0.650. All values are only meant to explain how the costs add up.
2.4 Procuring with MAI Code 2: Evaluating by Cost per Successful Task
For a team, the more useful question isn’t “is the premium really just 5%?” — it’s setting up a simple evaluation process:
- Pick samples: Choose 20–50 representative historical tasks from your own repo, covering bug fixes, test writing, refactoring, and similar categories.
- Fix the conditions: Standardize the reasoning tier, agent framework, and whether sub-agents are enabled, so your setup doesn’t get muddled with the vendor’s benchmarking conditions.
- Record usage: Save the input tokens, cached input tokens, output tokens, and number of attempts for every call.
- Judge success: Apply a dual standard — tests passing plus human review — and record rework time.
- Compute at both prices: Run the numbers at the promotional price and the regular price; any budget that spans May 17, 2027 should use the regular price.
💡 Recommendation: The choice between MAI Code 2 and Flash comes down to task difficulty. On simple tasks, Flash’s lower unit price is a clear win; on complex tasks, the gap in success rate can offset the gap in unit price. If you also want to benchmark against other mainstream coding models, you can use the unified OpenAI-compatible interface from APIYI apiyi.com to run the same batch of tasks, making side-by-side comparison easy.
2.5 MAI Code 2: Changes Worth Watching
The following points will directly affect whether that “5%” holds up in your scenario. They’re things to watch, not predictions:
- Independent replication: 3 of the 4 benchmarks come from Microsoft’s internal framework. Whether third parties reach similar conclusions on public frameworks is worth keeping an eye on.
- Pricing on other channels: The current reference materials only cover GitHub Copilot rates. Prices on Azure AI Foundry or other platforms should be taken from their respective official announcements.
- Promotional timeline: Regular pricing resumes on May 17, 2027 (the official notice doesn’t specify a time zone), so the actual ratio will need to be recalculated at that point.
If you want to establish your own cost baseline on a coding model you’re already familiar with, start by checking the current model list and rates for the channel you use—such as APIYI apiyi.com—then set up a like-for-like task comparison. The Copilot unit price in this article’s script can’t be used directly as a third-party channel bill.
The number in the headline only tells you where a vendor got a good result on a particular playing field. Your bill can only be calculated in your own repository. As Lu You wrote in “Reading with My Son on a Winter Night”: “What you get from books is shallow after all; to truly know a thing, you must do it yourself.”
📚 References
-
Microsoft AI – Introducing MAI Code 2 and MAI Code 2 Flash: Release announcement and benchmark details
- Link: Microsoft official release announcement
- Note: The original source of the “96% performance at 5% of the cost” claim, covering the four benchmarks, max effort, and the 50% promotional pricing details
-
GitHub Docs – Copilot models and pricing: Copilot model rates
- Link: GitHub Copilot official pricing and promotional footnote
- Note: Promotional and regular pricing for MAI Code 2 and Flash, the restoration date, and AI credit conversion
Author: APIYI Technical Team
Technical discussion: Feel free to reach us through the homepage of the APIYI official website at apiyi.com; more integration resources are available at the docs.apiyi.com documentation center