監控 Nano Banana Pro API 可用性是開發者保障圖像生成業務穩定運行的關鍵需求。本文將介紹 3 種實用的 Nano Banana Pro API 監控方法,幫助你實時掌握服務狀態,快速響應故障。
核心價值: 讀完本文,你將學會使用 Google 官方狀態頁和 OpenRouter 第三方監控工具,建立完整的 Nano Banana Pro API 可用性監控體系。
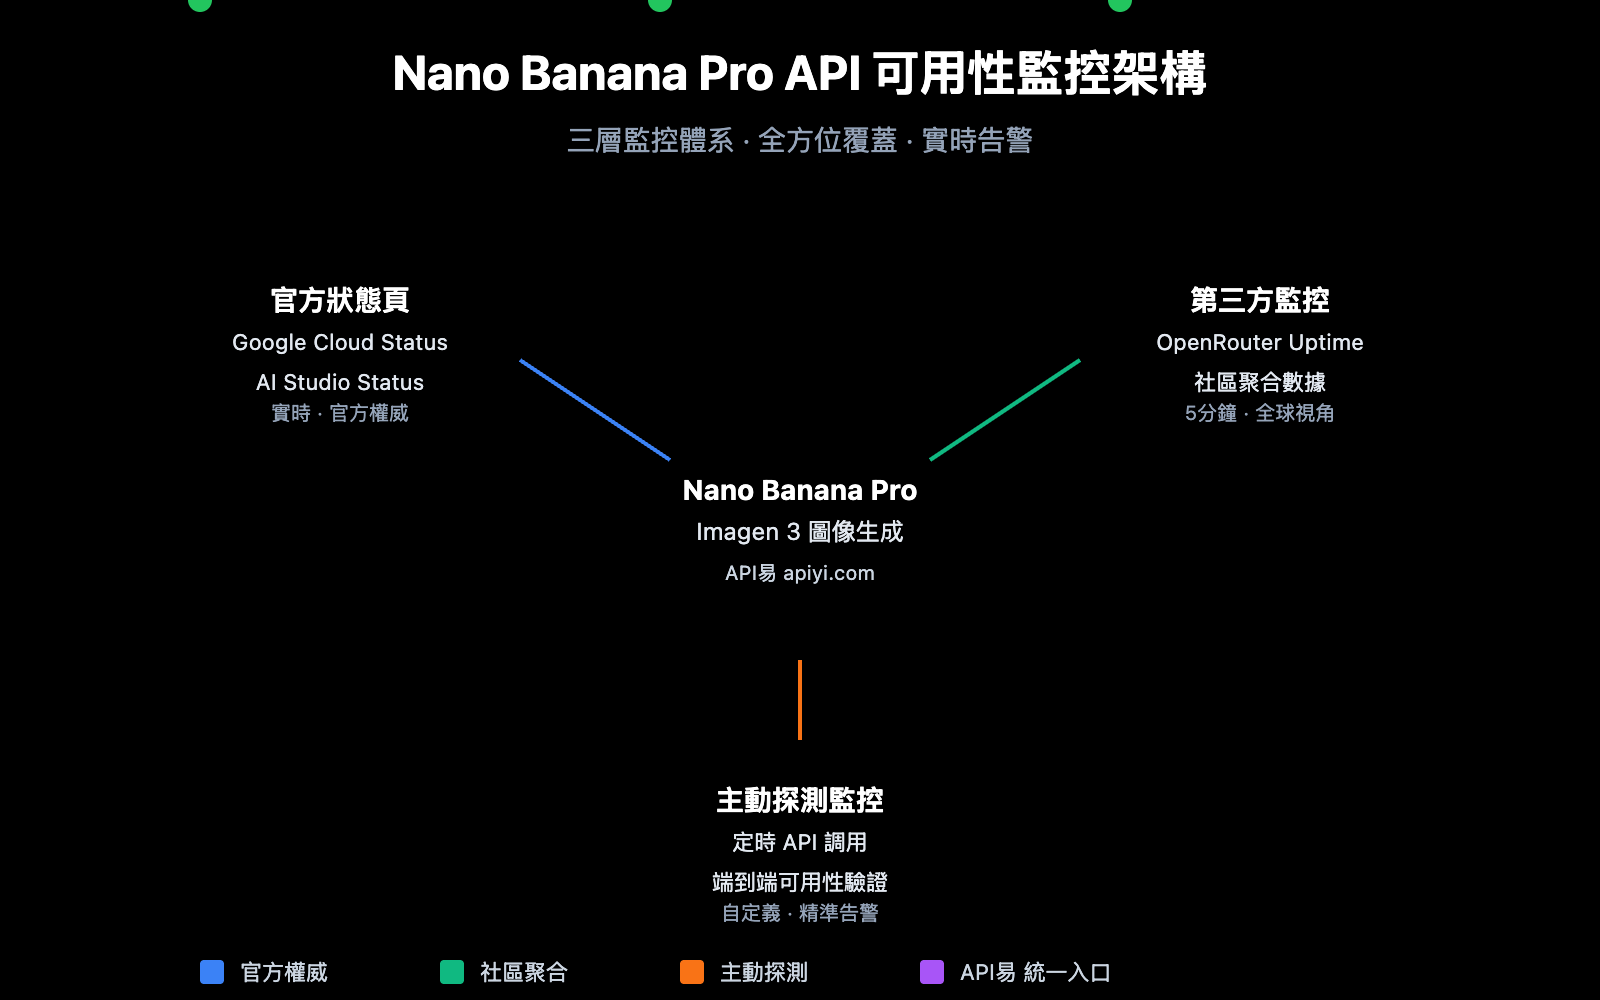
Nano Banana Pro API 監控核心要點
Nano Banana Pro (基於 Google Imagen 3) 是當前最強大的 AI 圖像生成模型之一。由於其底層依賴 Google Cloud 基礎設施,監控策略需要覆蓋多個層面。
| 監控層面 | 監控來源 | 監控內容 | 更新頻率 |
|---|---|---|---|
| 基礎設施層 | Google Cloud Status | 計算、網絡、存儲服務 | 實時 |
| AI 服務層 | AI Studio Status | Gemini、Imagen 模型服務 | 實時 |
| 第三方聚合 | OpenRouter Uptime | API 響應率、延遲統計 | 5 分鐘 |
| 主動探測 | 自建監控腳本 | 端到端可用性測試 | 自定義 |
Nano Banana Pro API 監控關鍵指標
監控 Nano Banana Pro API 時,需要關注以下核心指標:
| 指標名稱 | 正常範圍 | 告警閾值 | 說明 |
|---|---|---|---|
| API 可用率 | ≥ 99.5% | < 99% | 服務整體可用性 |
| 響應延遲 | 5-15 秒 | > 30 秒 | 圖像生成耗時 |
| 錯誤率 | < 1% | > 5% | 請求失敗比例 |
| 限流觸發 | 0 次/小時 | > 10 次/小時 | Rate Limit 命中 |
🎯 技術建議: 在實際開發中,我們建議通過 API易 apiyi.com 平臺進行 Nano Banana Pro API 調用。該平臺提供統一的狀態監控和告警服務,降低自建監控成本。
Nano Banana Pro API 監控方法一: Google 官方狀態頁
Google Cloud Status 監控
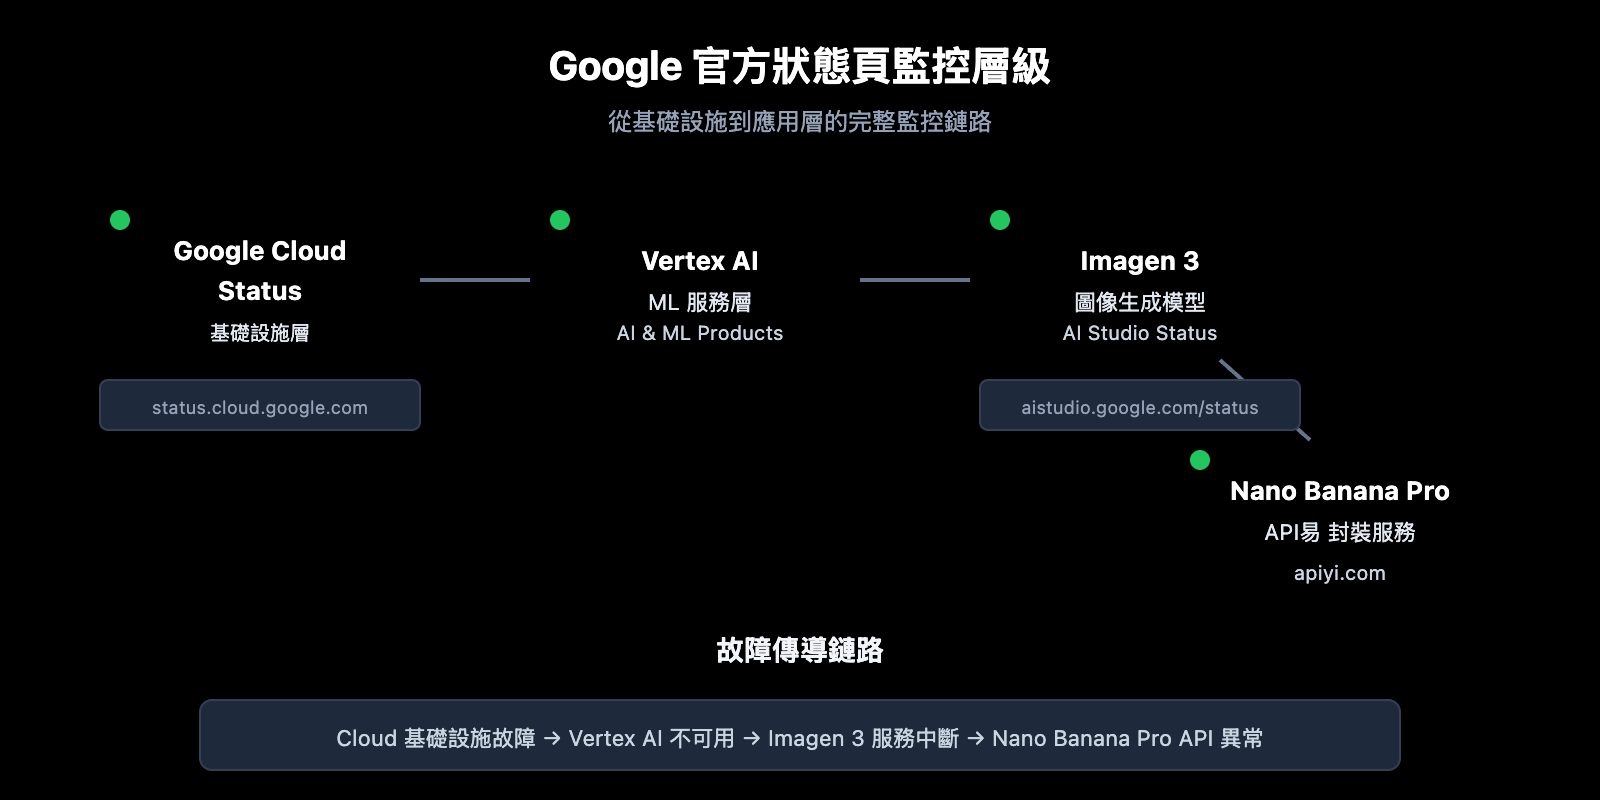
Google Cloud Status 頁面提供 Google 基礎設施的實時狀態信息,是監控 Nano Banana Pro 底層服務的首選來源。
官方狀態頁地址: status.cloud.google.com
關鍵監控服務
| 服務名稱 | 狀態頁位置 | 影響範圍 |
|---|---|---|
| Vertex AI | AI & Machine Learning | 直接影響 Imagen 3 |
| Cloud Storage | Storage | 影響圖像存儲和返回 |
| Cloud Run | Compute | 影響 API 網關服務 |
| Cloud Load Balancing | Networking | 影響請求路由 |
狀態訂閱設置
Google Cloud Status 支持多種訂閱方式:
# 示例: 使用 Google Cloud Status API 獲取狀態
import requests

def check_google_cloud_status():
    """
    檢查 Google Cloud 服務狀態
    通過 API易 apiyi.com 統一接口調用
    """
    # Google Cloud Status RSS Feed
    status_url = "https://status.cloud.google.com/incidents.json"

    try:
        response = requests.get(status_url, timeout=10)
        incidents = response.json()

        # 篩選 Vertex AI 相關事件
        vertex_incidents = [
            inc for inc in incidents
            if 'Vertex AI' in str(inc.get('affected_products', []))
        ]

        return {
            'status': 'healthy' if not vertex_incidents else 'degraded',
            'incidents': vertex_incidents
        }
    except Exception as e:
        return {'status': 'unknown', 'error': str(e)}

# 執行檢查
result = check_google_cloud_status()
print(f"Vertex AI 狀態: {result['status']}")
AI Studio Status 監控
Google AI Studio 提供 Gemini 和 Imagen 模型的專屬狀態頁面。
AI Studio 狀態頁地址: aistudio.google.com/status
| 監控項 | 說明 | 檢查頻率 |
|---|---|---|
| Gemini Models | 文本生成模型狀態 | 實時 |
| Imagen Models | 圖像生成模型狀態 | 實時 |
| API Quota | 配額使用情況 | 每小時 |
| Regional Status | 各區域服務狀態 | 實時 |
查看 AI Studio 狀態監控完整代碼
import requests
from datetime import datetime, timedelta
import json

class AIStudioMonitor:
    """
    AI Studio 狀態監控類
    適用於監控 Nano Banana Pro (Imagen 3) 服務狀態
    """

    def __init__(self, api_key: str):
        self.api_key = api_key
        # 使用 API易 統一接口
        self.base_url = "https://api.apiyi.com/v1"
        self.status_history = []

    def check_imagen_health(self) -> dict:
        """
        通過實際 API 調用檢測 Imagen 3 服務健康狀態
        """
        try:
            headers = {
                "Authorization": f"Bearer {self.api_key}",
                "Content-Type": "application/json"
            }

            # 發送輕量級測試請求
            test_payload = {
                "model": "nano-banana-pro",
                "prompt": "health check test",
                "n": 1,
                "size": "256x256"  # 最小尺寸減少成本
            }

            start_time = datetime.now()
            response = requests.post(
                f"{self.base_url}/images/generations",
                headers=headers,
                json=test_payload,
                timeout=60
            )
            latency = (datetime.now() - start_time).total_seconds()

            if response.status_code == 200:
                return {
                    'status': 'healthy',
                    'latency': latency,
                    'timestamp': datetime.now().isoformat()
                }
            elif response.status_code == 429:
                return {
                    'status': 'rate_limited',
                    'latency': latency,
                    'timestamp': datetime.now().isoformat()
                }
            else:
                return {
                    'status': 'degraded',
                    'error_code': response.status_code,
                    'timestamp': datetime.now().isoformat()
                }

        except requests.Timeout:
            return {
                'status': 'timeout',
                'timestamp': datetime.now().isoformat()
            }
        except Exception as e:
            return {
                'status': 'error',
                'error': str(e),
                'timestamp': datetime.now().isoformat()
            }

    def get_uptime_stats(self, hours: int = 24) -> dict:
        """
        計算過去 N 小時的可用性統計
        """
        cutoff = datetime.now() - timedelta(hours=hours)
        recent_checks = [
            s for s in self.status_history
            if datetime.fromisoformat(s['timestamp']) > cutoff
        ]

        if not recent_checks:
            return {'uptime': 'N/A', 'sample_count': 0}

        healthy_count = sum(1 for s in recent_checks if s['status'] == 'healthy')
        uptime_pct = (healthy_count / len(recent_checks)) * 100

        return {
            'uptime': f"{uptime_pct:.2f}%",
            'sample_count': len(recent_checks),
            'healthy_count': healthy_count,
            'period_hours': hours
        }

# 使用示例
monitor = AIStudioMonitor(api_key="your-apiyi-key")
health = monitor.check_imagen_health()
print(f"Nano Banana Pro 健康狀態: {health}")
💡 選擇建議: 選擇監控方案主要取決於您的具體需求。我們建議通過 API易 apiyi.com 平臺進行 API 調用測試,該平臺提供內置的狀態監控面板,便於快速查看服務可用性。
Nano Banana Pro API 監控方法二: OpenRouter 第三方監控
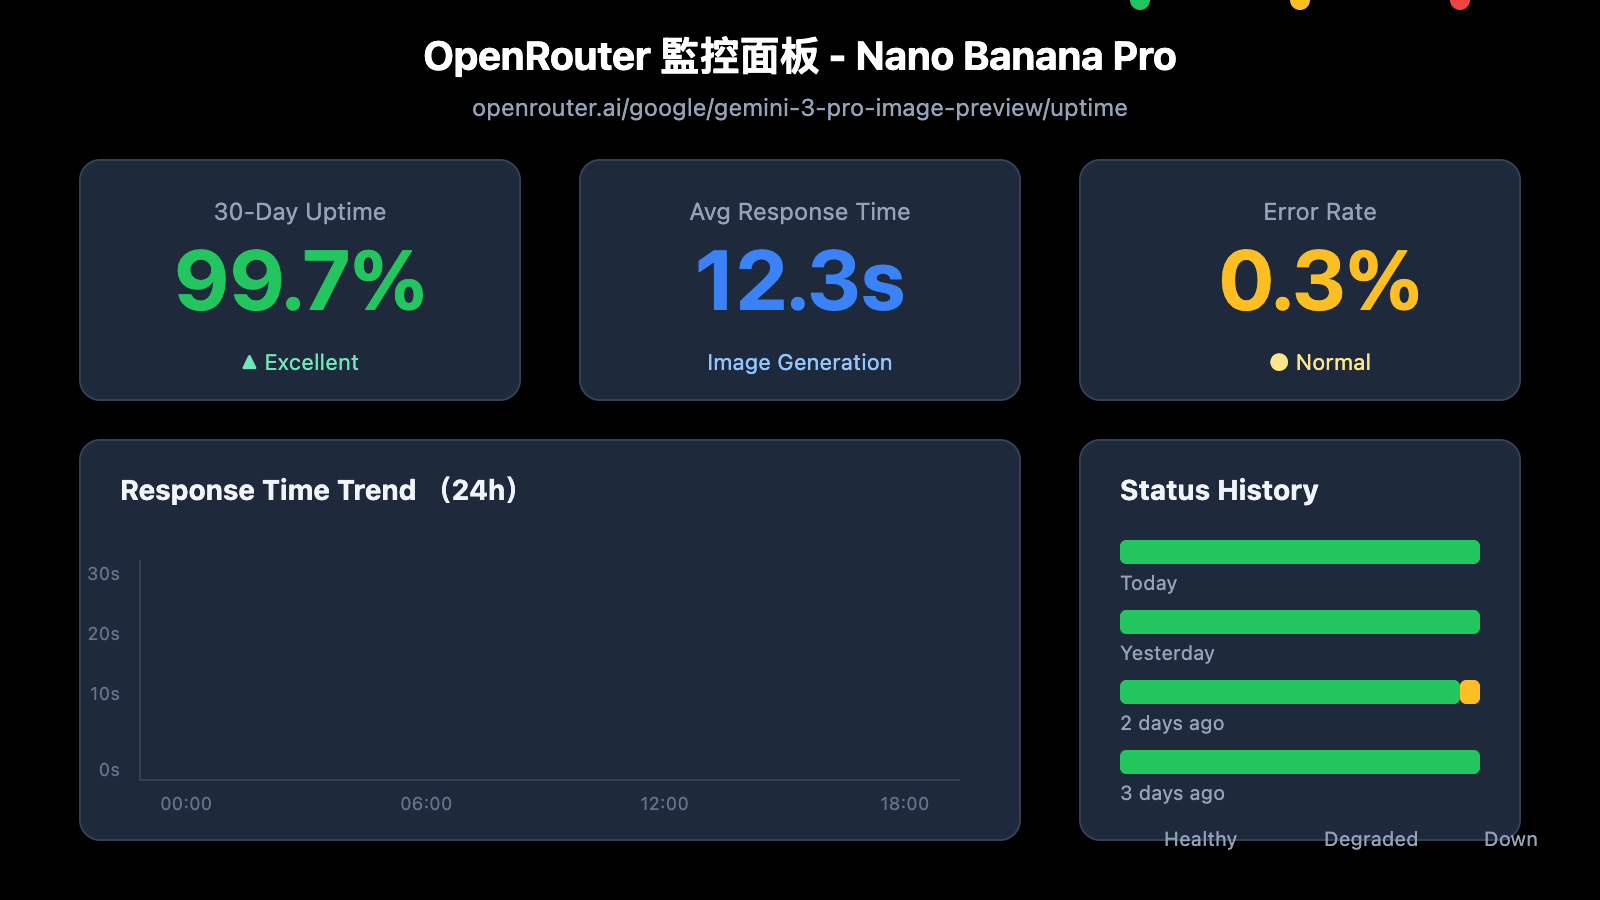
OpenRouter 提供專業的第三方 AI 模型監控服務,是監控 Nano Banana Pro API 可用性的重要補充。
OpenRouter Uptime 監控頁面
Nano Banana Pro 監控地址: openrouter.ai/google/gemini-3-pro-image-preview/uptime
OpenRouter 監控數據解讀
| 數據指標 | 含義 | 參考值 |
|---|---|---|
| Uptime % | 過去 30 天可用性 | ≥ 99% 爲優秀 |
| Avg Latency | 平均響應延遲 | 圖像生成 10-20s 正常 |
| P95 Latency | 95% 請求延遲 | < 30s 爲正常 |
| Error Rate | 請求錯誤率 | < 2% 爲健康 |
| Throughput | 請求吞吐量 | 反映模型熱度 |
監控數據獲取腳本
import requests
from bs4 import BeautifulSoup
import json

def get_openrouter_uptime(model_id: str = "google/gemini-3-pro-image-preview"):
    """
    獲取 OpenRouter 模型可用性數據
    適用於 Nano Banana Pro (Imagen 3) 監控
    """
    uptime_url = f"https://openrouter.ai/{model_id}/uptime"

    # 注意: OpenRouter 可能需要 API 調用獲取詳細數據
    # 這裏展示基本的可用性檢查思路

    try:
        # 通過 OpenRouter API 獲取模型信息
        api_url = "https://openrouter.ai/api/v1/models"
        response = requests.get(api_url, timeout=10)
        models = response.json().get('data', [])

        # 查找目標模型
        target_model = next(
            (m for m in models if m.get('id') == model_id),
            None
        )

        if target_model:
            return {
                'model_id': model_id,
                'status': 'available' if target_model else 'unknown',
                'pricing': target_model.get('pricing', {}),
                'context_length': target_model.get('context_length'),
                'uptime_url': uptime_url
            }
        else:
            return {
                'model_id': model_id,
                'status': 'not_found',
                'uptime_url': uptime_url
            }

    except Exception as e:
        return {
            'model_id': model_id,
            'status': 'error',
            'error': str(e)
        }

# 檢查 Nano Banana Pro 狀態
nano_status = get_openrouter_uptime()
print(json.dumps(nano_status, indent=2))
多模型對比監控
通過 OpenRouter 可以同時監控多個圖像生成模型的狀態:
| 模型 | OpenRouter ID | 監控價值 |
|---|---|---|
| Nano Banana Pro | google/gemini-3-pro-image-preview | 主要監控目標 |
| DALL-E 3 | openai/dall-e-3 | 備選方案狀態 |
| Stable Diffusion 3 | stabilityai/stable-diffusion-3 | 備選方案狀態 |
| Midjourney | – | 暫不支持 API |
🚀 快速開始: 推薦使用 API易 apiyi.com 平臺快速搭建圖像生成原型。該平臺提供開箱即用的多模型切換能力,當主模型不可用時可自動切換備選模型。
Nano Banana Pro API 監控方法三: 主動探測監控
除了被動訂閱狀態頁,主動探測是確保業務穩定的關鍵手段。
定時探測腳本
import openai
import time
import json
from datetime import datetime
import schedule

# 使用 API易 統一接口
client = openai.OpenAI(
    api_key="your-apiyi-key",
    base_url="https://api.apiyi.com/v1"
)

class NanoBananaProMonitor:
    """
    Nano Banana Pro API 主動探測監控
    """

    def __init__(self):
        self.check_results = []
        self.alert_threshold = 3  # 連續失敗 3 次觸發告警
        self.consecutive_failures = 0

    def health_check(self) -> dict:
        """
        執行一次健康檢查
        """
        start_time = time.time()

        try:
            response = client.images.generate(
                model="nano-banana-pro",
                prompt="A simple red circle on white background",
                n=1,
                size="256x256"
            )

            latency = time.time() - start_time

            result = {
                'timestamp': datetime.now().isoformat(),
                'status': 'success',
                'latency': round(latency, 2),
                'model': 'nano-banana-pro'
            }

            self.consecutive_failures = 0

        except openai.RateLimitError:
            result = {
                'timestamp': datetime.now().isoformat(),
                'status': 'rate_limited',
                'latency': time.time() - start_time,
                'model': 'nano-banana-pro'
            }
            # Rate limit 不計入失敗

        except openai.APIError as e:
            result = {
                'timestamp': datetime.now().isoformat(),
                'status': 'api_error',
                'error': str(e),
                'model': 'nano-banana-pro'
            }
            self.consecutive_failures += 1

        except Exception as e:
            result = {
                'timestamp': datetime.now().isoformat(),
                'status': 'error',
                'error': str(e),
                'model': 'nano-banana-pro'
            }
            self.consecutive_failures += 1

        self.check_results.append(result)

        # 檢查是否需要告警
        if self.consecutive_failures >= self.alert_threshold:
            self.send_alert(result)

        return result

    def send_alert(self, result: dict):
        """
        發送告警通知
        可對接: 企業微信、釘釘、飛書、Slack、郵件等
        """
        alert_message = f"""
        🚨 Nano Banana Pro API 告警

        狀態: {result.get('status')}
        時間: {result.get('timestamp')}
        錯誤: {result.get('error', 'N/A')}
        連續失敗: {self.consecutive_failures} 次
        """

        print(alert_message)
        # 實際項目中對接通知渠道
        # self.send_wechat(alert_message)
        # self.send_feishu(alert_message)

    def get_statistics(self, hours: int = 24) -> dict:
        """
        獲取監控統計數據
        """
        from datetime import timedelta

        cutoff = datetime.now() - timedelta(hours=hours)
        recent = [
            r for r in self.check_results
            if datetime.fromisoformat(r['timestamp']) > cutoff
        ]

        if not recent:
            return {'message': 'No data available'}

        success_count = sum(1 for r in recent if r['status'] == 'success')
        total_count = len(recent)

        latencies = [r['latency'] for r in recent if 'latency' in r and r['status'] == 'success']
        avg_latency = sum(latencies) / len(latencies) if latencies else 0

        return {
            'period_hours': hours,
            'total_checks': total_count,
            'success_count': success_count,
            'uptime_percentage': round((success_count / total_count) * 100, 2),
            'avg_latency': round(avg_latency, 2),
            'last_check': recent[-1] if recent else None
        }

# 創建監控實例
monitor = NanoBananaProMonitor()

# 設置定時任務: 每 5 分鐘檢查一次
schedule.every(5).minutes.do(monitor.health_check)

# 運行監控 (生產環境使用)
# while True:
#     schedule.run_pending()
#     time.sleep(1)

# 單次檢查示例
result = monitor.health_check()
print(json.dumps(result, indent=2, ensure_ascii=False))
查看完整監控系統代碼 (含告警對接)
import openai
import requests
import time
import json
import schedule
import threading
from datetime import datetime, timedelta
from typing import Optional, List, Dict
from dataclasses import dataclass, asdict
from enum import Enum

class AlertChannel(Enum):
    FEISHU = "feishu"
    WECHAT = "wechat"
    DINGTALK = "dingtalk"
    SLACK = "slack"
    EMAIL = "email"

@dataclass
class CheckResult:
    timestamp: str
    status: str
    latency: Optional[float] = None
    error: Optional[str] = None
    model: str = "nano-banana-pro"

@dataclass
class AlertConfig:
    enabled: bool = True
    channels: List[AlertChannel] = None
    threshold: int = 3
    cooldown_minutes: int = 30
    webhook_urls: Dict[str, str] = None

class EnterpriseMonitor:
    """
    企業級 Nano Banana Pro API 監控系統
    支持多通道告警、數據持久化、監控面板
    """

    def __init__(
        self,
        api_key: str,
        base_url: str = "https://api.apiyi.com/v1",
        alert_config: Optional[AlertConfig] = None
    ):
        self.client = openai.OpenAI(
            api_key=api_key,
            base_url=base_url
        )
        self.alert_config = alert_config or AlertConfig()
        self.check_results: List[CheckResult] = []
        self.consecutive_failures = 0
        self.last_alert_time: Optional[datetime] = None
        self._lock = threading.Lock()

    def health_check(self) -> CheckResult:
        """
        執行健康檢查
        """
        start_time = time.time()

        try:
            response = self.client.images.generate(
                model="nano-banana-pro",
                prompt="health check: simple geometric shape",
                n=1,
                size="256x256"
            )

            latency = time.time() - start_time
            result = CheckResult(
                timestamp=datetime.now().isoformat(),
                status="success",
                latency=round(latency, 2)
            )

            with self._lock:
                self.consecutive_failures = 0

        except openai.RateLimitError:
            result = CheckResult(
                timestamp=datetime.now().isoformat(),
                status="rate_limited",
                latency=round(time.time() - start_time, 2)
            )

        except openai.APIError as e:
            result = CheckResult(
                timestamp=datetime.now().isoformat(),
                status="api_error",
                error=str(e)
            )
            with self._lock:
                self.consecutive_failures += 1

        except Exception as e:
            result = CheckResult(
                timestamp=datetime.now().isoformat(),
                status="error",
                error=str(e)
            )
            with self._lock:
                self.consecutive_failures += 1

        with self._lock:
            self.check_results.append(result)

            # 保留最近 1000 條記錄
            if len(self.check_results) > 1000:
                self.check_results = self.check_results[-1000:]

        # 檢查告警條件
        self._check_alert(result)

        return result

    def _check_alert(self, result: CheckResult):
        """
        檢查是否需要發送告警
        """
        if not self.alert_config.enabled:
            return

        if self.consecutive_failures < self.alert_config.threshold:
            return

        # 檢查告警冷卻
        if self.last_alert_time:
            cooldown = timedelta(minutes=self.alert_config.cooldown_minutes)
            if datetime.now() - self.last_alert_time < cooldown:
                return

        self._send_alerts(result)
        self.last_alert_time = datetime.now()

    def _send_alerts(self, result: CheckResult):
        """
        發送多通道告警
        """
        message = self._format_alert_message(result)

        if not self.alert_config.webhook_urls:
            print(f"[ALERT] {message}")
            return

        for channel, webhook_url in self.alert_config.webhook_urls.items():
            try:
                if channel == "feishu":
                    self._send_feishu_alert(webhook_url, message)
                elif channel == "wechat":
                    self._send_wechat_alert(webhook_url, message)
                elif channel == "dingtalk":
                    self._send_dingtalk_alert(webhook_url, message)
                elif channel == "slack":
                    self._send_slack_alert(webhook_url, message)
            except Exception as e:
                print(f"Failed to send {channel} alert: {e}")

    def _format_alert_message(self, result: CheckResult) -> str:
        """
        格式化告警消息
        """
        return f"""
🚨 Nano Banana Pro API 異常告警

📊 狀態詳情:
• 狀態: {result.status}
• 時間: {result.timestamp}
• 錯誤: {result.error or 'N/A'}
• 連續失敗: {self.consecutive_failures} 次

🔗 監控來源:
• Google Cloud Status: status.cloud.google.com
• OpenRouter Uptime: openrouter.ai/google/gemini-3-pro-image-preview/uptime
• API易 監控: apiyi.com

⚡ 建議操作:
1. 檢查 Google Cloud 狀態頁
2. 驗證 API 密鑰是否有效
3. 檢查網絡連接狀態
4. 聯繫 API易 技術支持
        """.strip()

    def _send_feishu_alert(self, webhook_url: str, message: str):
        """飛書機器人告警"""
        payload = {
            "msg_type": "text",
            "content": {"text": message}
        }
        requests.post(webhook_url, json=payload, timeout=10)

    def _send_wechat_alert(self, webhook_url: str, message: str):
        """企業微信機器人告警"""
        payload = {
            "msgtype": "text",
            "text": {"content": message}
        }
        requests.post(webhook_url, json=payload, timeout=10)

    def _send_dingtalk_alert(self, webhook_url: str, message: str):
        """釘釘機器人告警"""
        payload = {
            "msgtype": "text",
            "text": {"content": message}
        }
        requests.post(webhook_url, json=payload, timeout=10)

    def _send_slack_alert(self, webhook_url: str, message: str):
        """Slack 機器人告警"""
        payload = {"text": message}
        requests.post(webhook_url, json=payload, timeout=10)

    def get_dashboard_data(self) -> dict:
        """
        獲取監控面板數據
        """
        now = datetime.now()

        # 計算不同時間段統計
        periods = {
            '1h': timedelta(hours=1),
            '6h': timedelta(hours=6),
            '24h': timedelta(hours=24),
            '7d': timedelta(days=7)
        }

        stats = {}
        for period_name, delta in periods.items():
            cutoff = now - delta
            recent = [
                r for r in self.check_results
                if datetime.fromisoformat(r.timestamp) > cutoff
            ]

            if recent:
                success = sum(1 for r in recent if r.status == 'success')
                latencies = [r.latency for r in recent if r.latency]

                stats[period_name] = {
                    'total': len(recent),
                    'success': success,
                    'uptime': round((success / len(recent)) * 100, 2),
                    'avg_latency': round(sum(latencies) / len(latencies), 2) if latencies else None
                }
            else:
                stats[period_name] = None

        return {
            'model': 'nano-banana-pro',
            'current_status': self.check_results[-1].status if self.check_results else 'unknown',
            'consecutive_failures': self.consecutive_failures,
            'statistics': stats,
            'last_update': now.isoformat()
        }

# 使用示例
if __name__ == "__main__":
    # 配置告警
    alert_config = AlertConfig(
        enabled=True,
        threshold=3,
        cooldown_minutes=30,
        webhook_urls={
            "feishu": "https://open.feishu.cn/open-apis/bot/v2/hook/xxx",
            # "wechat": "https://qyapi.weixin.qq.com/cgi-bin/webhook/send?key=xxx",
        }
    )

    # 創建監控實例
    monitor = EnterpriseMonitor(
        api_key="your-apiyi-key",
        base_url="https://api.apiyi.com/v1",
        alert_config=alert_config
    )

    # 執行檢查
    result = monitor.health_check()
    print("檢查結果:", asdict(result))

    # 獲取面板數據
    dashboard = monitor.get_dashboard_data()
    print("面板數據:", json.dumps(dashboard, indent=2, ensure_ascii=False))
Nano Banana Pro API 監控告警配置
告警通道對接
| 通道 | Webhook 格式 | 適用場景 |
|---|---|---|
| 飛書 | open.feishu.cn/open-apis/bot/v2/hook/xxx | 國內企業首選 |
| 企業微信 | qyapi.weixin.qq.com/cgi-bin/webhook/send | 微信生態用戶 |
| 釘釘 | oapi.dingtalk.com/robot/send | 阿里系企業 |
| Slack | hooks.slack.com/services/xxx | 海外團隊 |
| 郵件 | SMTP 配置 | 正式記錄 |
告警級別定義
# 告警級別配置
ALERT_LEVELS = {
    'info': {
        'triggers': ['rate_limited'],
        'channels': ['log'],
        'color': '#36a64f'
    },
    'warning': {
        'triggers': ['timeout', 'degraded'],
        'channels': ['feishu', 'slack'],
        'color': '#ff9800'
    },
    'critical': {
        'triggers': ['api_error', 'error'],
        'channels': ['feishu', 'wechat', 'slack', 'email'],
        'color': '#f44336'
    }
}
💰 成本優化: 對於預算敏感的項目,可以考慮通過 API易 apiyi.com 平臺調用 Nano Banana Pro API。該平臺提供靈活的計費方式和內置監控功能,降低自建監控成本。
Nano Banana Pro API 監控最佳實踐
監控策略組合
根據業務重要性,選擇合適的監控策略組合:
| 業務級別 | 官方狀態頁 | 第三方監控 | 主動探測 | 告警通道 |
|---|---|---|---|---|
| 核心業務 | ✅ 訂閱 | ✅ OpenRouter | ✅ 1分鐘 | 多通道 |
| 重要業務 | ✅ 訂閱 | ✅ OpenRouter | ✅ 5分鐘 | 飛書+郵件 |
| 普通業務 | ✅ 訂閱 | 可選 | ✅ 15分鐘 | 飛書 |
| 測試環境 | 可選 | – | ✅ 30分鐘 | 日誌 |
故障響應流程
檢測到異常
    ↓
確認影響範圍 (生產/測試)
    ↓
檢查官方狀態頁
    ↓
├── 官方確認故障 → 等待恢復 + 通知用戶
├── 官方正常 → 檢查自身配置
│   ├── API Key 有效性
│   ├── 配額使用情況
│   ├── 網絡連接狀態
│   └── 請求參數合規性
└── 無法確定 → 聯繫技術支持
監控數據分析
import pandas as pd
from datetime import datetime, timedelta

def analyze_monitoring_data(check_results: list) -> dict:
    """
    分析監控數據,生成報告
    """
    df = pd.DataFrame(check_results)
    df['timestamp'] = pd.to_datetime(df['timestamp'])

    # 按小時統計
    df['hour'] = df['timestamp'].dt.floor('H')
    hourly_stats = df.groupby('hour').agg({
        'status': lambda x: (x == 'success').mean() * 100,
        'latency': 'mean'
    }).rename(columns={
        'status': 'uptime_pct',
        'latency': 'avg_latency'
    })

    # 識別異常時段
    anomalies = hourly_stats[hourly_stats['uptime_pct'] < 99]

    # 延遲趨勢
    df['date'] = df['timestamp'].dt.date
    daily_latency = df.groupby('date')['latency'].mean()

    return {
        'hourly_stats': hourly_stats.to_dict(),
        'anomaly_periods': anomalies.index.tolist(),
        'daily_latency_trend': daily_latency.to_dict(),
        'overall_uptime': df[df['status'] == 'success'].shape[0] / len(df) * 100
    }
常見問題
Q1: Nano Banana Pro API 監控頻率設置多少合適?
監控頻率取決於業務重要性:
- 核心生產環境: 建議 1-2 分鐘檢查一次
- 重要業務: 5 分鐘檢查一次
- 普通業務: 10-15 分鐘檢查一次
通過 API易 apiyi.com 平臺可以獲取免費測試額度,快速驗證監控方案可行性。注意平衡監控成本和響應速度。
Q2: 如何區分 Nano Banana Pro 臨時波動和真正故障?
建議採用以下策略:
- 連續失敗閾值: 設置連續 3 次以上失敗才觸發告警
- 滑動窗口: 5 分鐘內失敗率超過 50% 才認定故障
- 多源驗證: 同時檢查官方狀態頁確認是否官方故障
- 排除 Rate Limit: 限流不等於故障
通過 API易 apiyi.com 平臺的監控面板,可以直觀查看歷史可用性趨勢,快速判斷是否爲系統性故障。
Q3: OpenRouter 第三方監控數據可靠嗎?
OpenRouter 作爲知名的 AI 模型聚合平臺,其監控數據具有參考價值:
- 優勢: 聚合全球用戶請求數據,樣本量大
- 侷限: 可能包含 OpenRouter 自身鏈路問題
- 建議: 結合官方狀態頁和自建監控綜合判斷
Q4: 監控告警太多導致疲勞怎麼辦?
告警疲勞是常見問題,建議:
- 設置告警級別: 區分 Info、Warning、Critical
- 配置冷卻時間: 同一問題 30 分鐘內只告警一次
- 聚合告警: 相似問題合併爲一條告警
- 告警抑制: 維護期間臨時關閉告警
- 持續優化: 定期回顧誤報,調整閾值
總結
Nano Banana Pro API 可用性監控是保障圖像生成業務穩定的關鍵環節。本文介紹了 3 種實用監控方法:
- Google 官方狀態頁: 監控 Cloud Status 和 AI Studio Status,獲取第一手官方信息
- OpenRouter 第三方監控: 利用 openrouter.ai 的 Uptime 頁面獲取社區級可用性數據
- 主動探測監控: 通過定時 API 調用實現端到端可用性驗證
推薦通過 API易 apiyi.com 快速驗證監控方案效果,該平臺提供統一的 API 接口和內置監控面板,幫助開發者降低運維成本。
作者: APIYI 技術團隊
技術交流: 歡迎訪問 API易 apiyi.com 獲取更多 AI API 使用技巧和最佳實踐
更新日期: 2026-01-28
相關資源
| 資源類型 | 說明 |
|---|---|
| Google Cloud Status | status.cloud.google.com |
| AI Studio Status | aistudio.google.com/status |
| OpenRouter Uptime | openrouter.ai/google/gemini-3-pro-image-preview/uptime |
| API易 官網 | apiyi.com |