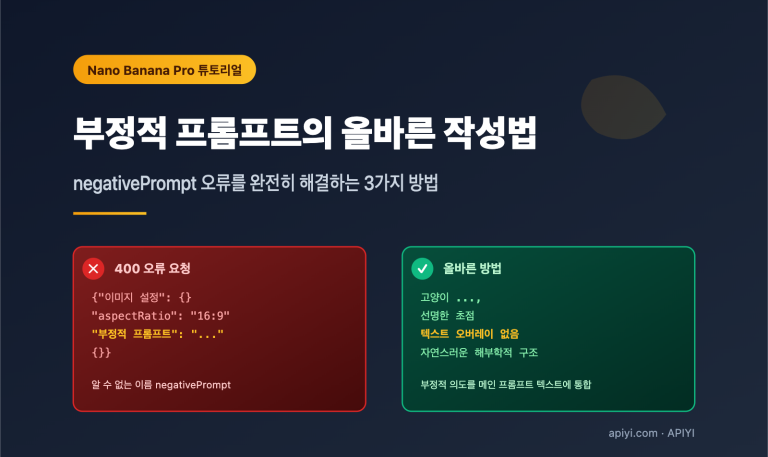
Nano Banana Pro API 가용성을 모니터링하는 것은 개발자가 이미지 생성 비즈니스를 안정적으로 운영하기 위해 꼭 필요한 과정입니다. 이 글에서는 서비스 상태를 실시간으로 파악하고 장애에 빠르게 대응할 수 있도록 돕는 3가지 실용적인 Nano Banana Pro API 모니터링 방법을 소개해 드릴게요.
핵심 가치: 이 글을 읽고 나면 구글 공식 상태 페이지와 OpenRouter 제3자 모니터링 도구를 활용해 완벽한 Nano Banana Pro API 가용성 모니터링 체계를 구축하는 방법을 배우게 됩니다.
Nano Banana Pro API 모니터링 핵심 요점
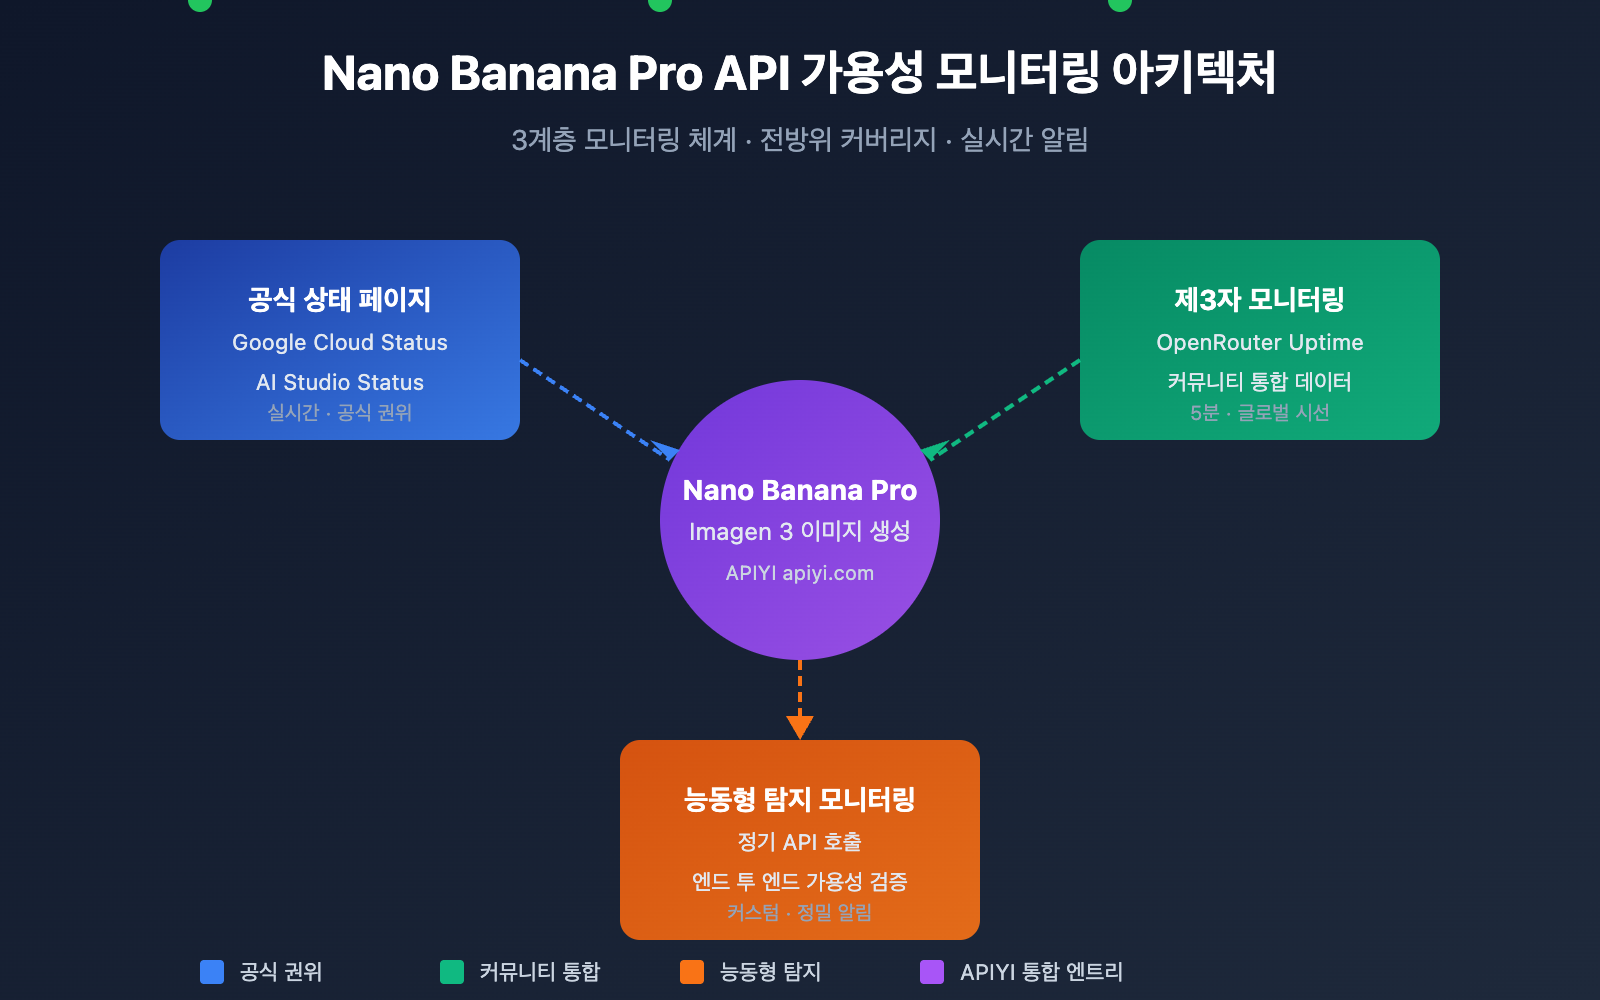
Nano Banana Pro(Google Imagen 3 기반)는 현재 가장 강력한 AI 이미지 생성 모델 중 하나입니다. 기반 인프라가 Google Cloud에 의존하고 있기 때문에 모니터링 전략은 여러 계층을 아울러야 합니다.
| 모니터링 계층 | 모니터링 소스 | 모니터링 내용 | 업데이트 빈도 |
|---|---|---|---|
| 인프라 계층 | Google Cloud Status | 컴퓨팅, 네트워크, 스토리지 서비스 | 실시간 |
| AI 서비스 계층 | AI Studio Status | Gemini, Imagen 모델 서비스 | 실시간 |
| 제3자 통합 | OpenRouter Uptime | API 응답률, 지연 시간 통계 | 5분 |
| 능동형 탐지 | 자체 모니터링 스크립트 | 엔드 투 엔드 가용성 테스트 | 사용자 정의 |
Nano Banana Pro API 모니터링 주요 지표
Nano Banana Pro API를 모니터링할 때 주의 깊게 살펴봐야 할 핵심 지표들입니다.
| 지표 이름 | 정상 범위 | 알림 임계값 | 설명 |
|---|---|---|---|
| API 가용률 | ≥ 99.5% | < 99% | 서비스 전체 가용성 |
| 응답 지연 시간 | 5-15초 | > 30초 | 이미지 생성 소요 시간 |
| 오류율 | < 1% | > 5% | 요청 실패 비율 |
| 속도 제한 트리거 | 0회/시간 | > 10회/시간 | Rate Limit 도달 횟수 |
🎯 기술 제언: 실제 개발 환경에서는 APIYI(apiyi.com) 플랫폼을 통해 Nano Banana Pro API를 호출하는 것을 추천드립니다. 해당 플랫폼은 통합된 상태 모니터링과 알림 서비스를 제공하여 자체 모니터링 구축 비용을 줄여줍니다.
Nano Banana Pro API 모니터링 방법 1: Google 공식 상태 페이지
Google Cloud Status 모니터링
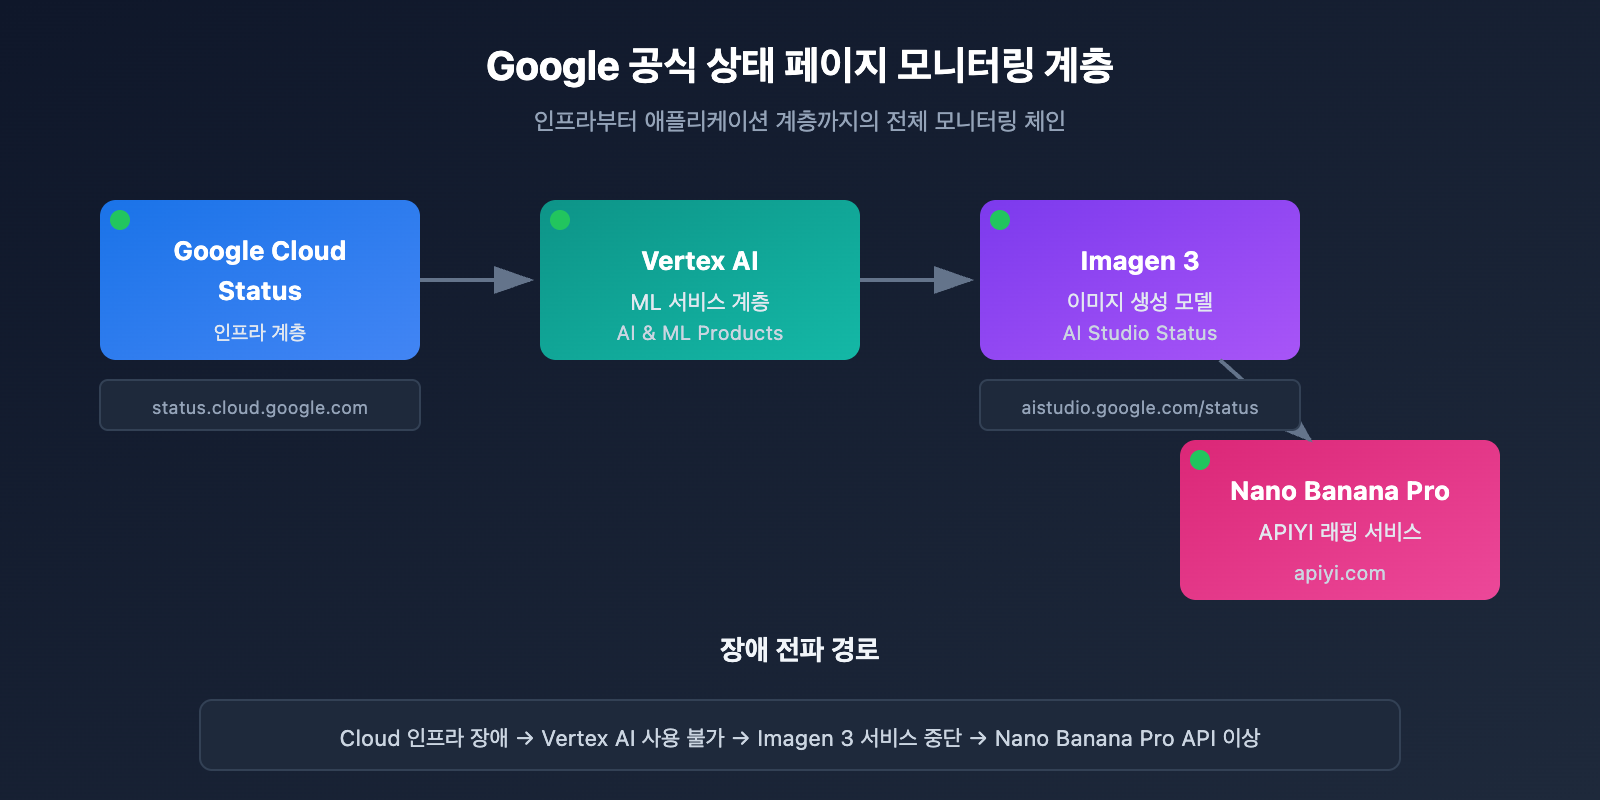
Google Cloud Status 페이지는 Google 인프라의 실시간 상태 정보를 제공하며, Nano Banana Pro의 하위 서비스를 모니터링하는 데 가장 권장되는 소스입니다.
공식 상태 페이지 주소: status.cloud.google.com
핵심 모니터링 서비스
| 서비스 명 | 상태 페이지 위치 | 영향 범위 |
|---|---|---|
| Vertex AI | AI & Machine Learning | Imagen 3에 직접적인 영향 |
| Cloud Storage | Storage | 이미지 저장 및 반환에 영향 |
| Cloud Run | Compute | API 게이트웨이 서비스에 영향 |
| Cloud Load Balancing | Networking | 요청 라우팅에 영향 |
상태 구독 설정
Google Cloud Status는 다양한 구독 방식을 지원해요:
# 예시: Google Cloud Status API를 사용하여 상태 조회
import requests

def check_google_cloud_status():
    """
    Google Cloud 서비스 상태 확인
    APIYI apiyi.com 통합 인터페이스를 통해 호출
    """
    # Google Cloud Status RSS 피드
    status_url = "https://status.cloud.google.com/incidents.json"

    try:
        response = requests.get(status_url, timeout=10)
        incidents = response.json()

        # Vertex AI 관련 이벤트 필터링
        vertex_incidents = [
            inc for inc in incidents
            if 'Vertex AI' in str(inc.get('affected_products', []))
        ]

        return {
            'status': 'healthy' if not vertex_incidents else 'degraded',
            'incidents': vertex_incidents
        }
    except Exception as e:
        return {'status': 'unknown', 'error': str(e)}

# 검사 실행
result = check_google_cloud_status()
print(f"Vertex AI 상태: {result['status']}")
AI Studio Status 모니터링
Google AI Studio는 Gemini 및 Imagen 모델 전용 상태 페이지를 제공합니다.
AI Studio 상태 페이지 주소: aistudio.google.com/status
| 모니터링 항목 | 설명 | 검사 빈도 |
|---|---|---|
| Gemini Models | 텍스트 생성 모델 상태 | 실시간 |
| Imagen Models | 이미지 생성 모델 상태 | 실시간 |
| API Quota | 쿼터 사용 현황 | 매시간 |
| Regional Status | 지역별 서비스 상태 | 실시간 |
AI Studio 상태 모니터링 전체 코드 보기
import requests
from datetime import datetime, timedelta
import json

class AIStudioMonitor:
    """
    AI Studio 상태 모니터링 클래스
    Nano Banana Pro (Imagen 3) 서비스 상태 모니터링에 적합
    """

    def __init__(self, api_key: str):
        self.api_key = api_key
        # APIYI 통합 인터페이스 사용
        self.base_url = "https://api.apiyi.com/v1"
        self.status_history = []

    def check_imagen_health(self) -> dict:
        """
        실제 API 호출을 통한 Imagen 3 서비스 헬스 체크
        """
        try:
            headers = {
                "Authorization": f"Bearer {self.api_key}",
                "Content-Type": "application/json"
            }

            # 경량 테스트 요청 전송
            test_payload = {
                "model": "nano-banana-pro",
                "prompt": "health check test",
                "n": 1,
                "size": "256x256"  # 비용 절감을 위한 최소 크기
            }

            start_time = datetime.now()
            response = requests.post(
                f"{self.base_url}/images/generations",
                headers=headers,
                json=test_payload,
                timeout=60
            )
            latency = (datetime.now() - start_time).total_seconds()

            if response.status_code == 200:
                return {
                    'status': 'healthy',
                    'latency': latency,
                    'timestamp': datetime.now().isoformat()
                }
            elif response.status_code == 429:
                return {
                    'status': 'rate_limited',
                    'latency': latency,
                    'timestamp': datetime.now().isoformat()
                }
            else:
                return {
                    'status': 'degraded',
                    'error_code': response.status_code,
                    'timestamp': datetime.now().isoformat()
                }

        except requests.Timeout:
            return {
                'status': 'timeout',
                'timestamp': datetime.now().isoformat()
            }
        except Exception as e:
            return {
                'status': 'error',
                'error': str(e),
                'timestamp': datetime.now().isoformat()
            }

    def get_uptime_stats(self, hours: int = 24) -> dict:
        """
        지난 N시간 동안의 가용성 통계 계산
        """
        cutoff = datetime.now() - timedelta(hours=hours)
        recent_checks = [
            s for s in self.status_history
            if datetime.fromisoformat(s['timestamp']) > cutoff
        ]

        if not recent_checks:
            return {'uptime': 'N/A', 'sample_count': 0}

        healthy_count = sum(1 for s in recent_checks if s['status'] == 'healthy')
        uptime_pct = (healthy_count / len(recent_checks)) * 100

        return {
            'uptime': f"{uptime_pct:.2f}%",
            'sample_count': len(recent_checks),
            'healthy_count': healthy_count,
            'period_hours': hours
        }

# 사용 예시
monitor = AIStudioMonitor(api_key="your-apiyi-key")
health = monitor.check_imagen_health()
print(f"Nano Banana Pro 건강 상태: {health}")
💡 선택 가이드: 모니터링 솔루션 선택은 구체적인 요구 사항에 따라 달라집니다. APIYI apiyi.com 플랫폼을 통한 API 호출 테스트를 권장드려요. 이 플랫폼은 내장된 상태 모니터링 대시보드를 제공하여 서비스 가용성을 빠르게 확인할 수 있게 해줍니다.
Nano Banana Pro API 모니터링 방법 2: OpenRouter 제3자 모니터링
OpenRouter는 전문적인 제3자 AI 모델 모니터링 서비스를 제공하며, Nano Banana Pro API의 가용성을 확인하는 데 중요한 보완 수단이 됩니다.
OpenRouter Uptime 모니터링 페이지
Nano Banana Pro 모니터링 주소: openrouter.ai/google/gemini-3-pro-image-preview/uptime
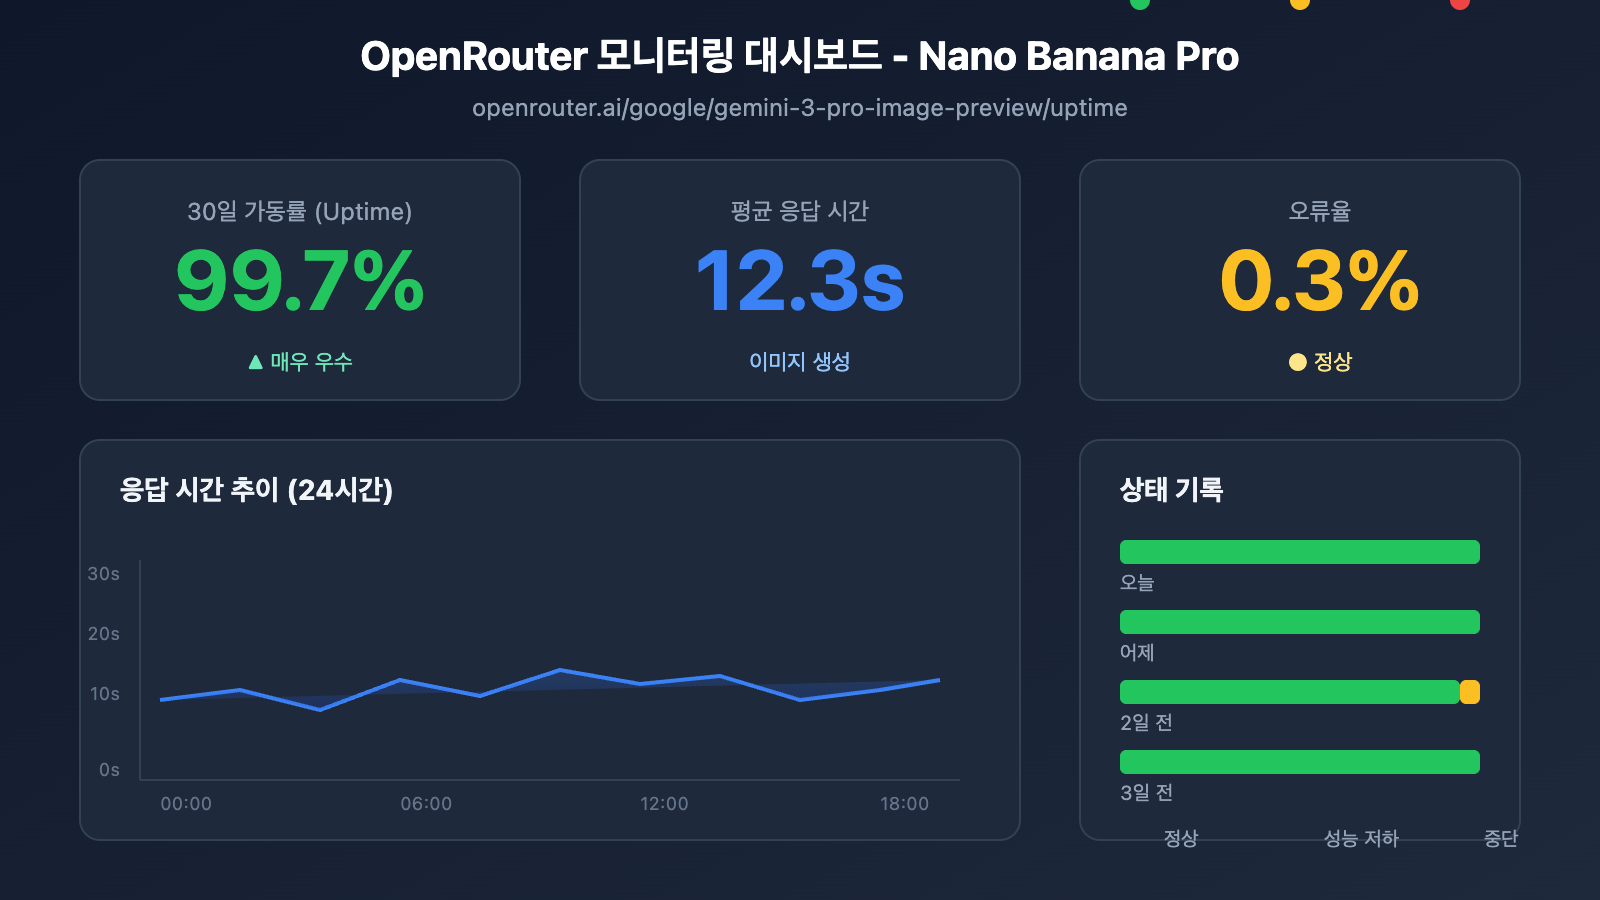
OpenRouter 모니터링 데이터 해석
| 데이터 지표 | 의미 | 참고값 |
|---|---|---|
| Uptime % | 지난 30일간의 가용성 | 99% 이상 시 우수 |
| Avg Latency | 평균 응답 지연 시간 | 이미지 생성 시 10~20s 정상 |
| P95 Latency | 95% 요청 지연 시간 | 30s 미만 시 정상 |
| Error Rate | 요청 오류율 | 2% 미만 시 정상 |
| Throughput | 요청 처리량 | 모델의 인기도를 반영 |
모니터링 데이터 수집 스크립트
import requests
from bs4 import BeautifulSoup
import json

def get_openrouter_uptime(model_id: str = "google/gemini-3-pro-image-preview"):
    """
    获取 OpenRouter 模型可用性数据
    适用于 Nano Banana Pro (Imagen 3) 监控
    """
    uptime_url = f"https://openrouter.ai/{model_id}/uptime"

    # 注意: OpenRouter 可能需要 API 调用获取详细数据
    # 这里展示基本的可用性检查思路

    try:
        # 通过 OpenRouter API 获取模型信息
        api_url = "https://openrouter.ai/api/v1/models"
        response = requests.get(api_url, timeout=10)
        models = response.json().get('data', [])

        # 查找目标模型
        target_model = next(
            (m for m in models if m.get('id') == model_id),
            None
        )

        if target_model:
            return {
                'model_id': model_id,
                'status': 'available' if target_model else 'unknown',
                'pricing': target_model.get('pricing', {}),
                'context_length': target_model.get('context_length'),
                'uptime_url': uptime_url
            }
        else:
            return {
                'model_id': model_id,
                'status': 'not_found',
                'uptime_url': uptime_url
            }

    except Exception as e:
        return {
            'model_id': model_id,
            'status': 'error',
            'error': str(e)
        }

# 检查 Nano Banana Pro 状态
nano_status = get_openrouter_uptime()
print(json.dumps(nano_status, indent=2))
다중 모델 비교 모니터링
OpenRouter를 이용하면 여러 이미지 생성 모델의 상태를 동시에 모니터링할 수 있어요.
| 모델 | OpenRouter ID | 모니터링 가치 |
|---|---|---|
| Nano Banana Pro | google/gemini-3-pro-image-preview | 주요 모니터링 대상 |
| DALL-E 3 | openai/dall-e-3 | 대안 모델 상태 확인 |
| Stable Diffusion 3 | stabilityai/stable-diffusion-3 | 대안 모델 상태 확인 |
| Midjourney | – | 현재 API 미지원 |
🚀 빠른 시작: 이미지 생성 프로토타입을 빠르게 구축하려면 APIYI (apiyi.com) 플랫폼을 추천해요. 이 플랫폼은 즉시 사용 가능한 다중 모델 전환 기능을 제공하여, 주 모델을 사용할 수 없을 때 자동으로 대안 모델로 전환해 줍니다.
Nano Banana Pro API 모니터링 방법 3: 능동적 탐지 모니터링
상태 페이지를 수동으로 구독하는 것 외에도, 능동적인 탐지는 비즈니스 안정성을 확보하는 핵심 수단이에요.
정기 탐지 스크립트
import openai
import time
import json
from datetime import datetime
import schedule

# APIYI 통합 인터페이스 사용
client = openai.OpenAI(
    api_key="your-apiyi-key",
    base_url="https://api.apiyi.com/v1"
)

class NanoBananaProMonitor:
    """
    Nano Banana Pro API 능동적 탐지 모니터링
    """

    def __init__(self):
        self.check_results = []
        self.alert_threshold = 3  # 3회 연속 실패 시 알림 트리거
        self.consecutive_failures = 0

    def health_check(self) -> dict:
        """
        상태 확인 1회 실행
        """
        start_time = time.time()

        try:
            response = client.images.generate(
                model="nano-banana-pro",
                prompt="A simple red circle on white background",
                n=1,
                size="256x256"
            )

            latency = time.time() - start_time

            result = {
                'timestamp': datetime.now().isoformat(),
                'status': 'success',
                'latency': round(latency, 2),
                'model': 'nano-banana-pro'
            }

            self.consecutive_failures = 0

        except openai.RateLimitError:
            result = {
                'timestamp': datetime.now().isoformat(),
                'status': 'rate_limited',
                'latency': time.time() - start_time,
                'model': 'nano-banana-pro'
            }
            # Rate limit은 실패로 간주하지 않음

        except openai.APIError as e:
            result = {
                'timestamp': datetime.now().isoformat(),
                'status': 'api_error',
                'error': str(e),
                'model': 'nano-banana-pro'
            }
            self.consecutive_failures += 1

        except Exception as e:
            result = {
                'timestamp': datetime.now().isoformat(),
                'status': 'error',
                'error': str(e),
                'model': 'nano-banana-pro'
            }
            self.consecutive_failures += 1

        self.check_results.append(result)

        # 알림 필요 여부 확인
        if self.consecutive_failures >= self.alert_threshold:
            self.send_alert(result)

        return result

    def send_alert(self, result: dict):
        """
        알림 통지 전송
        연동 가능 채널: 기업용 위챗, 딩톡, 페이슈(Feishu), Slack, 이메일 등
        """
        alert_message = f"""
        🚨 Nano Banana Pro API 알림

        상태: {result.get('status')}
        시간: {result.get('timestamp')}
        오류: {result.get('error', 'N/A')}
        연속 실패: {self.consecutive_failures}회
        """

        print(alert_message)
        # 실제 프로젝트에서는 알림 채널에 연동하세요
        # self.send_wechat(alert_message)
        # self.send_feishu(alert_message)

    def get_statistics(self, hours: int = 24) -> dict:
        """
        모니터링 통계 데이터 가져오기
        """
        from datetime import timedelta

        cutoff = datetime.now() - timedelta(hours=hours)
        recent = [
            r for r in self.check_results
            if datetime.fromisoformat(r['timestamp']) > cutoff
        ]

        if not recent:
            return {'message': 'No data available'}

        success_count = sum(1 for r in recent if r['status'] == 'success')
        total_count = len(recent)

        latencies = [r['latency'] for r in recent if 'latency' in r and r['status'] == 'success']
        avg_latency = sum(latencies) / len(latencies) if latencies else 0

        return {
            'period_hours': hours,
            'total_checks': total_count,
            'success_count': success_count,
            'uptime_percentage': round((success_count / total_count) * 100, 2),
            'avg_latency': round(avg_latency, 2),
            'last_check': recent[-1] if recent else None
        }

# 모니터링 인스턴스 생성
monitor = NanoBananaProMonitor()

# 정기 작업 설정: 5분마다 한 번씩 확인
schedule.every(5).minutes.do(monitor.health_check)

# 모니터링 실행 (운영 환경용)
# while True:
#     schedule.run_pending()
#     time.sleep(1)

# 단일 확인 예시
result = monitor.health_check()
print(json.dumps(result, indent=2, ensure_ascii=False))
전체 모니터링 시스템 코드 보기 (알림 연동 포함)
import openai
import requests
import time
import json
import schedule
import threading
from datetime import datetime, timedelta
from typing import Optional, List, Dict
from dataclasses import dataclass, asdict
from enum import Enum

class AlertChannel(Enum):
    FEISHU = "feishu"
    WECHAT = "wechat"
    DINGTALK = "dingtalk"
    SLACK = "slack"
    EMAIL = "email"

@dataclass
class CheckResult:
    timestamp: str
    status: str
    latency: Optional[float] = None
    error: Optional[str] = None
    model: str = "nano-banana-pro"

@dataclass
class AlertConfig:
    enabled: bool = True
    channels: List[AlertChannel] = None
    threshold: int = 3
    cooldown_minutes: int = 30
    webhook_urls: Dict[str, str] = None

class EnterpriseMonitor:
    """
    기업용 Nano Banana Pro API 모니터링 시스템
    다중 채널 알림, 데이터 영속화, 모니터링 대시보드 지원
    """

    def __init__(
        self,
        api_key: str,
        base_url: str = "https://api.apiyi.com/v1",
        alert_config: Optional[AlertConfig] = None
    ):
        self.client = openai.OpenAI(
            api_key=api_key,
            base_url=base_url
        )
        self.alert_config = alert_config or AlertConfig()
        self.check_results: List[CheckResult] = []
        self.consecutive_failures = 0
        self.last_alert_time: Optional[datetime] = None
        self._lock = threading.Lock()

    def health_check(self) -> CheckResult:
        """
        상태 확인 실행
        """
        start_time = time.time()

        try:
            response = self.client.images.generate(
                model="nano-banana-pro",
                prompt="health check: simple geometric shape",
                n=1,
                size="256x256"
            )

            latency = time.time() - start_time
            result = CheckResult(
                timestamp=datetime.now().isoformat(),
                status="success",
                latency=round(latency, 2)
            )

            with self._lock:
                self.consecutive_failures = 0

        except openai.RateLimitError:
            result = CheckResult(
                timestamp=datetime.now().isoformat(),
                status="rate_limited",
                latency=round(time.time() - start_time, 2)
            )

        except openai.APIError as e:
            result = CheckResult(
                timestamp=datetime.now().isoformat(),
                status="api_error",
                error=str(e)
            )
            with self._lock:
                self.consecutive_failures += 1

        except Exception as e:
            result = CheckResult(
                timestamp=datetime.now().isoformat(),
                status="error",
                error=str(e)
            )
            with self._lock:
                self.consecutive_failures += 1

        with self._lock:
            self.check_results.append(result)

            # 최근 1,000개 기록 유지
            if len(self.check_results) > 1000:
                self.check_results = self.check_results[-1000:]

        # 알림 조건 확인
        self._check_alert(result)

        return result

    def _check_alert(self, result: CheckResult):
        """
        알림 전송 필요 여부 확인
        """
        if not self.alert_config.enabled:
            return

        if self.consecutive_failures < self.alert_config.threshold:
            return

        # 알림 쿨다운 확인
        if self.last_alert_time:
            cooldown = timedelta(minutes=self.alert_config.cooldown_minutes)
            if datetime.now() - self.last_alert_time < cooldown:
                return

        self._send_alerts(result)
        self.last_alert_time = datetime.now()

    def _send_alerts(self, result: CheckResult):
        """
        다중 채널 알림 전송
        """
        message = self._format_alert_message(result)

        if not self.alert_config.webhook_urls:
            print(f"[ALERT] {message}")
            return

        for channel, webhook_url in self.alert_config.webhook_urls.items():
            try:
                if channel == "feishu":
                    self._send_feishu_alert(webhook_url, message)
                elif channel == "wechat":
                    self._send_wechat_alert(webhook_url, message)
                elif channel == "dingtalk":
                    self._send_dingtalk_alert(webhook_url, message)
                elif channel == "slack":
                    self._send_slack_alert(webhook_url, message)
            except Exception as e:
                print(f"Failed to send {channel} alert: {e}")

    def _format_alert_message(self, result: CheckResult) -> str:
        """
        알림 메시지 포맷 구성
        """
        return f"""
🚨 Nano Banana Pro API 이상 알림

📊 상태 상세 정보:
• 상태: {result.status}
• 시간: {result.timestamp}
• 오류: {result.error or 'N/A'}
• 연속 실패: {self.consecutive_failures}회

🔗 모니터링 출처:
• Google Cloud Status: status.cloud.google.com
• OpenRouter Uptime: openrouter.ai/google/gemini-3-pro-image-preview/uptime
• APIYI 모니터링: apiyi.com

⚡ 권장 조치:
1. Google Cloud 상태 페이지 확인
2. API 키 유효성 확인
3. 네트워크 연결 상태 확인
4. APIYI 기술 지원팀에 문의
        """.strip()

    def _send_feishu_alert(self, webhook_url: str, message: str):
        """페이슈(Feishu) 봇 알림"""
        payload = {
            "msg_type": "text",
            "content": {"text": message}
        }
        requests.post(webhook_url, json=payload, timeout=10)

    def _send_wechat_alert(self, webhook_url: str, message: str):
        """기업용 위챗 봇 알림"""
        payload = {
            "msgtype": "text",
            "text": {"content": message}
        }
        requests.post(webhook_url, json=payload, timeout=10)

    def _send_dingtalk_alert(self, webhook_url: str, message: str):
        """딩톡(DingTalk) 봇 알림"""
        payload = {
            "msgtype": "text",
            "text": {"content": message}
        }
        requests.post(webhook_url, json=payload, timeout=10)

    def _send_slack_alert(self, webhook_url: str, message: str):
        """Slack 봇 알림"""
        payload = {"text": message}
        requests.post(webhook_url, json=payload, timeout=10)

    def get_dashboard_data(self) -> dict:
        """
        모니터링 대시보드 데이터 가져오기
        """
        now = datetime.now()

        # 시간대별 통계 계산
        periods = {
            '1h': timedelta(hours=1),
            '6h': timedelta(hours=6),
            '24h': timedelta(hours=24),
            '7d': timedelta(days=7)
        }

        stats = {}
        for period_name, delta in periods.items():
            cutoff = now - delta
            recent = [
                r for r in self.check_results
                if datetime.fromisoformat(r.timestamp) > cutoff
            ]

            if recent:
                success = sum(1 for r in recent if r.status == 'success')
                latencies = [r.latency for r in recent if r.latency]

                stats[period_name] = {
                    'total': len(recent),
                    'success': success,
                    'uptime': round((success / len(recent)) * 100, 2),
                    'avg_latency': round(sum(latencies) / len(latencies), 2) if latencies else None
                }
            else:
                stats[period_name] = None

        return {
            'model': 'nano-banana-pro',
            'current_status': self.check_results[-1].status if self.check_results else 'unknown',
            'consecutive_failures': self.consecutive_failures,
            'statistics': stats,
            'last_update': now.isoformat()
        }

# 사용 예시
if __name__ == "__main__":
    # 알림 설정
    alert_config = AlertConfig(
        enabled=True,
        threshold=3,
        cooldown_minutes=30,
        webhook_urls={
            "feishu": "https://open.feishu.cn/open-apis/bot/v2/hook/xxx",
            # "wechat": "https://qyapi.weixin.qq.com/cgi-bin/webhook/send?key=xxx",
        }
    )

    # 모니터링 인스턴스 생성
    monitor = EnterpriseMonitor(
        api_key="your-apiyi-key",
        base_url="https://api.apiyi.com/v1",
        alert_config=alert_config
    )

    # 확인 실행
    result = monitor.health_check()
    print("확인 결과:", asdict(result))

    # 대시보드 데이터 가져오기
    dashboard = monitor.get_dashboard_data()
    print("대시보드 데이터:", json.dumps(dashboard, indent=2, ensure_ascii=False))
Nano Banana Pro API 모니터링 및 알림 설정
알림 채널 연동
| 채널 | Webhook 형식 | 활용 시나리오 |
|---|---|---|
| Lark(비서) | open.feishu.cn/open-apis/bot/v2/hook/xxx | 중국 내 협업 도구 사용 시 선호 |
| WeCom(기업용 위챗) | qyapi.weixin.qq.com/cgi-bin/webhook/send | 위챗 생태계 사용자에게 적합해요 |
| 딩톡(DingTalk) | oapi.dingtalk.com/robot/send | 알리바바 계열 서비스를 이용하는 경우 |
| Slack | hooks.slack.com/services/xxx | 글로벌 팀에서 가장 많이 사용해요 |
| 이메일 | SMTP 설정 | 공식적인 기록 보관용 |
알림 레벨 정의
# 告警级别配置
ALERT_LEVELS = {
    'info': {
        'triggers': ['rate_limited'],
        'channels': ['log'],
        'color': '#36a64f'
    },
    'warning': {
        'triggers': ['timeout', 'degraded'],
        'channels': ['feishu', 'slack'],
        'color': '#ff9800'
    },
    'critical': {
        'triggers': ['api_error', 'error'],
        'channels': ['feishu', 'wechat', 'slack', 'email'],
        'color': '#f44336'
    }
}
💰 비용 최적화: 예산이 민감한 프로젝트라면 APIYI(apiyi.com) 플랫폼을 통해 Nano Banana Pro API를 호출하는 것을 고려해 보세요. 이 플랫폼은 유연한 요금제와 내장 모니터링 기능을 제공하여, 자체 모니터링 시스템 구축 비용을 줄여줍니다.
Nano Banana Pro API 모니터링 베스트 프랙티스
모니터링 전략 조합
비즈니스의 중요도에 따라 적절한 모니터링 전략을 선택해 보세요.
| 비즈니스 등급 | 공식 상태 페이지 | 제3자 모니터링 | 능동적 탐지 | 알림 채널 |
|---|---|---|---|---|
| 핵심 서비스 | ✅ 구독 필수 | ✅ OpenRouter | ✅ 1분 간격 | 다중 채널 |
| 주요 서비스 | ✅ 구독 필수 | ✅ OpenRouter | ✅ 5분 간격 | Lark + 이메일 |
| 일반 서비스 | ✅ 구독 필수 | 선택 사항 | ✅ 15분 간격 | Lark |
| 테스트 환경 | 선택 사항 | – | ✅ 30분 간격 | 로그 기록 |
장애 대응 프로세스
이상 현상 감지
    ↓
영향 범위 확인 (운영/테스트)
    ↓
공식 상태 페이지 확인
    ↓
├── 공식 장애 확인됨 → 복구 대기 + 사용자 공지
├── 공식 상태 정상 → 자체 설정 점검
│   ├── API Key 유효성 확인
│   ├── 할당량(Quota) 사용 현황 확인
│   ├── 네트워크 연결 상태 점검
│   └── 요청 파라미터 규격 준수 여부 확인
└── 원인 파악 불가 → 기술 지원팀에 문의
모니터링 데이터 분석
import pandas as pd
from datetime import datetime, timedelta

def analyze_monitoring_data(check_results: list) -> dict:
    """
    모니터링 데이터를 분석하여 보고서를 생성합니다.
    """
    df = pd.DataFrame(check_results)
    df['timestamp'] = pd.to_datetime(df['timestamp'])

    # 시간대별 통계
    df['hour'] = df['timestamp'].dt.floor('H')
    hourly_stats = df.groupby('hour').agg({
        'status': lambda x: (x == 'success').mean() * 100,
        'latency': 'mean'
    }).rename(columns={
        'status': 'uptime_pct',
        'latency': 'avg_latency'
    })

    # 이상 발생 시간대 식별
    anomalies = hourly_stats[hourly_stats['uptime_pct'] < 99]

    # 지연 시간 트렌드
    df['date'] = df['timestamp'].dt.date
    daily_latency = df.groupby('date')['latency'].mean()

    return {
        'hourly_stats': hourly_stats.to_dict(),
        'anomaly_periods': anomalies.index.tolist(),
        'daily_latency_trend': daily_latency.to_dict(),
        'overall_uptime': df[df['status'] == 'success'].shape[0] / len(df) * 100
    }
자주 묻는 질문 (FAQ)
Q1: Nano Banana Pro API 모니터링 주기는 어느 정도가 적당할까요?
모니터링 주기는 비즈니스의 중요도에 따라 달라집니다:
- 핵심 프로덕션 환경: 1~2분마다 한 번씩 체크하는 것을 권장해요.
- 주요 비즈니스: 5분마다 한 번씩 체크하세요.
- 일반 비즈니스: 10~15분마다 한 번씩 체크해도 충분합니다.
APIYI apiyi.com 플랫폼에서 무료 테스트 크레딧을 받아 모니터링 방안의 실현 가능성을 빠르게 검증해 볼 수 있습니다. 모니터링 비용과 응답 속도 사이의 균형을 잘 맞추는 것이 중요합니다.
Q2: Nano Banana Pro의 일시적인 변동과 실제 장애를 어떻게 구분하나요?
다음과 같은 전략을 도입해 보세요:
- 연속 실패 임계값: 연속 3회 이상 실패할 때만 경고 알림을 보내도록 설정하세요.
- 슬라이딩 윈도우: 5분 이내 실패율이 50%를 넘을 때만 장애로 판단합니다.
- 교차 검증: 공식 상태 페이지를 함께 확인하여 공식적인 장애인지 파악하세요.
- Rate Limit 제외: 할당량 제한(Rate Limit)으로 인한 실패는 시스템 장애와 구분해야 합니다.
APIYI apiyi.com 플랫폼의 모니터링 대시보드를 활용하면 과거 가용성 트렌드를 직관적으로 확인하고, 시스템적인 장애 여부를 빠르게 판단할 수 있습니다.
Q3: OpenRouter의 제3자 모니터링 데이터는 믿을 만한가요?
OpenRouter는 인지도 높은 AI 모델 허브 플랫폼이므로, 해당 모니터링 데이터는 충분히 참고할 가치가 있습니다:
- 장점: 전 세계 사용자들의 요청 데이터를 취합하므로 표본이 방대합니다.
- 한계: OpenRouter 자체적인 네트워크 경로 문제가 포함되어 있을 수 있습니다.
- 권장: 공식 상태 페이지와 자체 구축한 모니터링 데이터를 결합하여 종합적으로 판단하는 것이 좋습니다.
Q4: 모니터링 알림이 너무 많아서 피로도가 높을 땐 어떻게 하죠?
알림 피로(Alert Fatigue)는 흔히 발생하는 문제예요. 이렇게 개선해 보세요:
- 알림 레벨 설정: Info, Warning, Critical로 중요도를 나누세요.
- 쿨다운 시간 설정: 동일한 문제에 대해서는 30분 이내에 한 번만 알림이 가도록 설정하세요.
- 알림 그룹화: 유사한 문제들을 하나의 알림으로 묶어서 보내세요.
- 알림 억제: 시스템 점검 중에는 일시적으로 알림을 꺼둡니다.
- 지속적인 최적화: 정기적으로 오탐 사례를 검토하고 임계값을 조정하세요.
요약
Nano Banana Pro API 가용성 모니터링은 이미지 생성 비즈니스의 안정성을 보장하는 핵심 요소입니다. 본 글에서는 세 가지 실용적인 모니터링 방법을 소개해 드렸습니다:
- Google 공식 상태 페이지: Cloud Status와 AI Studio Status를 모니터링하여 가장 정확한 공식 정보를 얻으세요.
- OpenRouter 제3자 모니터링: openrouter.ai의 Uptime 페이지를 통해 커뮤니티 수준의 가용성 데이터를 활용하세요.
- 능동적 탐지 모니터링: 정기적인 API 호출을 통해 엔드 투 엔드(End-to-End) 가용성을 직접 검증하세요.
APIYI apiyi.com을 통해 모니터링 방안의 효과를 빠르게 검증해 보시는 것을 추천드려요. 이 플랫폼은 통합 API 인터페이스와 내장 모니터링 대시보드를 제공하여 개발자의 운영 부담을 크게 줄여줍니다.
작성자: APIYI 기술 팀
기술 교류: APIYI apiyi.com을 방문하여 더 많은 AI API 활용 팁과 베스트 프랙티스를 만나보세요.
업데이트 날짜: 2026-01-28
관련 리소스
| 리소스 유형 | 설명 |
|---|---|
| Google Cloud 상태 | status.cloud.google.com |
| AI Studio 상태 | aistudio.google.com/status |
| OpenRouter 가동 시간 | openrouter.ai/google/gemini-3-pro-image-preview/uptime |
| APIYI 공식 홈페이지 | apiyi.com |