Author's Note: A step-by-step guide to using Nano Banana Pro for creating four types of scientific methodology diagrams—model architectures, algorithm flowcharts, encoder-decoder frameworks, and system pipelines. Includes prompt templates and best practices.
Methodology diagrams in research papers are the first point of entry for reviewers and readers to understand your approach—a clear architecture diagram is often more persuasive than a full page of text. However, manually crafting a publication-quality methodology diagram usually takes 4 to 8 hours of design work. Nano Banana Pro's scientific graphing capabilities are changing the game. As the core rendering engine of the PaperBanana framework, it can precisely convert text descriptions into professional methodology diagrams complete with shapes, connectors, and scientific icons.
Core Value: By the end of this article, you'll master the complete prompt templates, a 3-stage workflow, and 7 key practical tips for creating these four types of methodology diagrams using Nano Banana Pro, significantly boosting your paper's illustration efficiency.
Core Essentials of Nano Banana Pro for Scientific Diagramming
| Key Point | Description | Value |
|---|---|---|
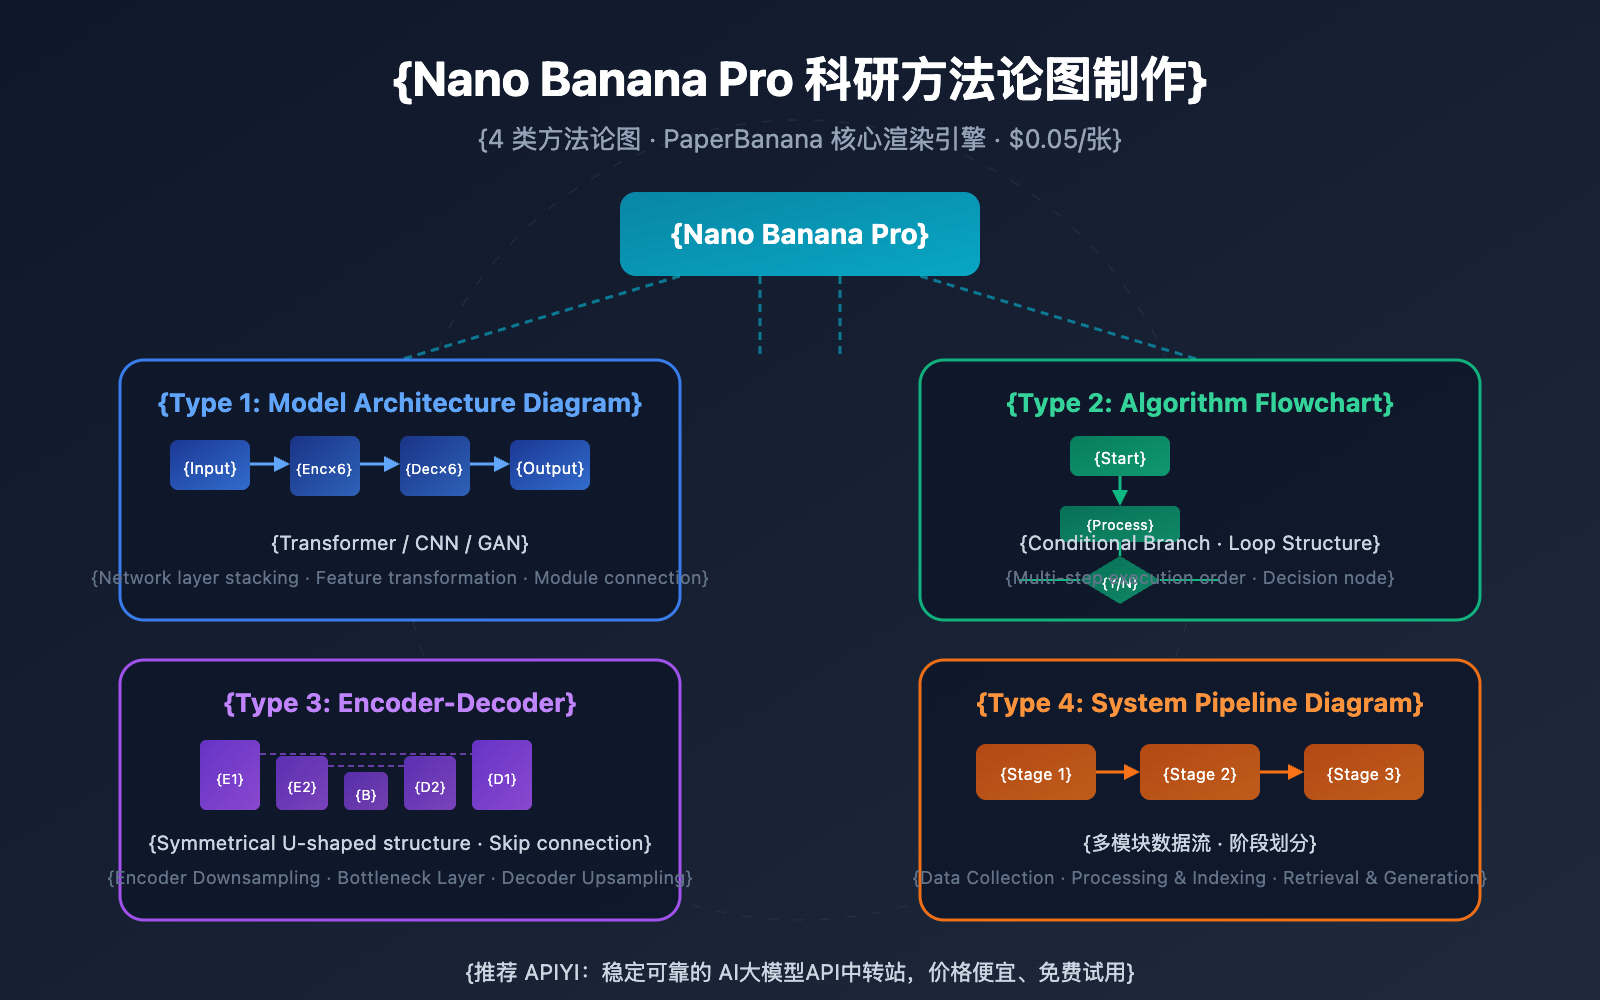
| 4 Types of Methodology Diagrams | Model architectures, algorithm flowcharts, encoder-decoder frameworks, and system pipelines | Covers over 90% of AI paper illustration needs |
| PaperBanana Core Engine | The Visualizer agent uses Nano Banana Pro to render methodology diagrams | Precisely generates shapes, connectors, and scientific icons |
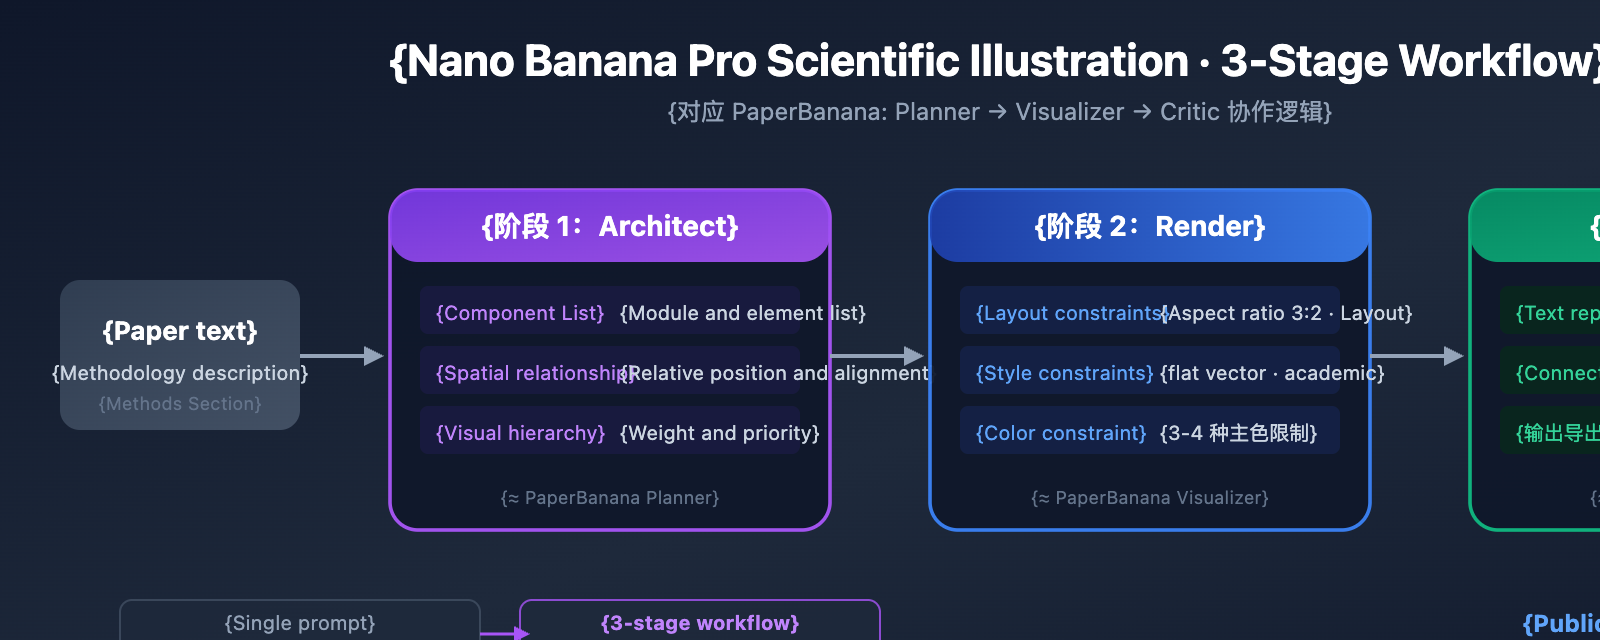
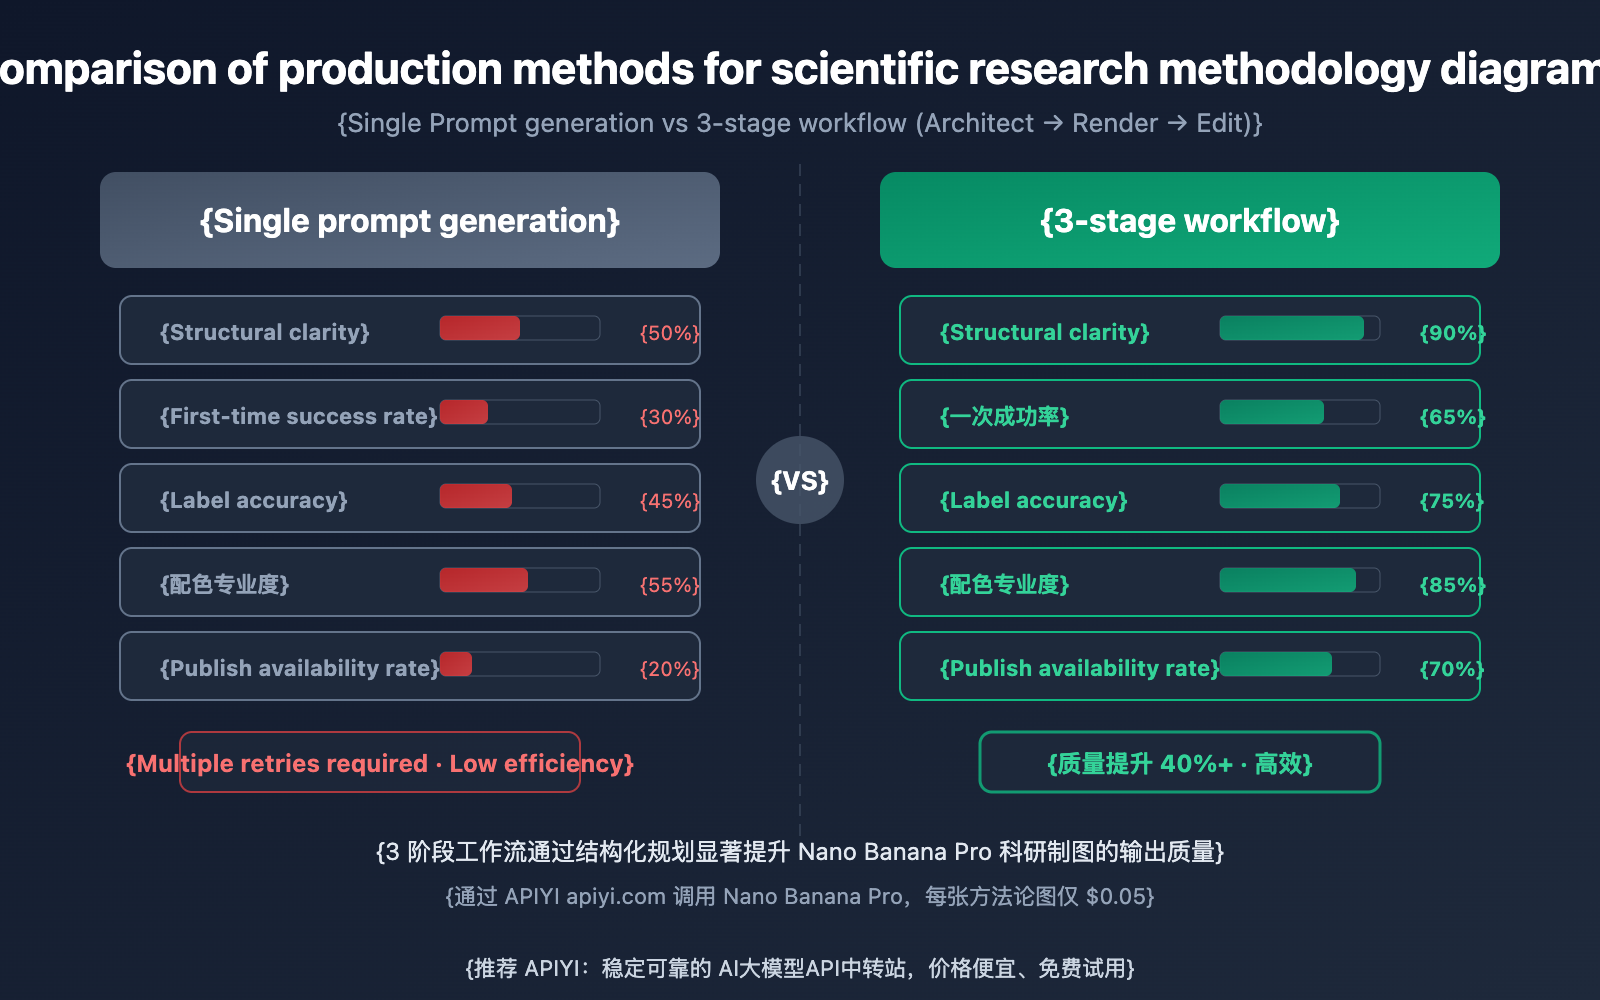
| 3-Stage Workflow | Architect (Planning) → Render → Edit (Refinement) | Improves quality by 40%+ compared to single-prompt generation |
| Planner → Visualizer Collaboration | Planner generates structured layout plans; Visualizer handles precise rendering | Spatial relationships, component hierarchies, and visual levels—all in one go |
| Low Cost: $0.05/Image | Called via APIYI, as low as 20% of official pricing | Batch generate candidates and pick the best version |
Why Nano Banana Pro is Perfect for Methodology Diagrams
Methodology diagrams are the bread and butter of the PaperBanana framework. Unlike statistical charts that focus on hard numbers, methodology diagrams are all about illustrating the logical relationships between components, data flow, and spatial hierarchy—which happens to be Nano Banana Pro's specialty. In PaperBanana's benchmarks, methodology diagrams rendered by the Visualizer agent using Nano Banana Pro scored a 72.7% win rate in blind evaluations across 292 NeurIPS 2025 test cases.
To be more specific, Nano Banana Pro really stands out when it comes to generating precise geometric shapes and rounded rectangles, rendering crisp arrows and connectors, and getting component labels and placement just right. Plus, it uses academic-friendly color palettes. These features make it a powerhouse for creating model architectures, algorithm flows, encoder-decoder frameworks, and system pipelines that are ready for top-tier conferences.
Detailed Explanation of 4 Types of Methodology Diagrams with Nano Banana Pro
Type 1: Model Architecture
Model architecture diagrams are the most common type of methodology figure in deep learning papers. They need to show how network layers are stacked, the feature transformation process, and key modules. Nano Banana Pro excels at rendering visual representations of classic architectures like Transformers, CNNs, and GANs.
Prompt Template:
Generate a clean academic methodology diagram showing a Vision Transformer
(ViT) architecture. Layout: left-to-right flow.

Components:
- Input image (224×224) split into 16×16 patches
- Linear embedding layer (flat rectangles)
- Positional encoding (small + symbol)
- 12× Transformer encoder blocks (stacked rounded rectangles)
  - Each block: Multi-Head Self-Attention → Layer Norm → MLP → Layer Norm
- Classification head (single rectangle)
- Output: class prediction

Style: flat vector, academic, clean lines, minimal colors (blue primary,
gray secondary), white background, labeled components with short identifiers.
Aspect ratio: 3:2. No decorative elements.
Key Tips:
- Use "left-to-right flow" or "top-to-bottom flow" to explicitly specify the data direction.
- Use "rounded rectangles" and "flat rectangles" to distinguish between different types of network layers.
- Use short identifiers for labels (e.g., "MHA", "FFN", "LN") to avoid layout clutter caused by long text.
- Specify "no decorative elements" to prevent the AI from adding unnecessary fluff.
Type 2: Algorithm Flowchart
Algorithm flowcharts need to express the execution sequence of multiple steps, conditional branches, and loop structures. PaperBanana's Planner agent deconstructs algorithm descriptions into structured visual layout plans—including element types, spatial relationships, and connection methods—which are then precisely rendered by Nano Banana Pro.
Prompt Template:
Generate an academic algorithm flowchart for a self-supervised learning
training pipeline. Layout: top-to-bottom with branching.

Steps:
1. Input: Unlabeled dataset (cylinder shape)
2. Data augmentation: two augmented views (branching into two paths)
3. Left path: Online encoder → Projector → Predictor
4. Right path: Target encoder → Projector (with stop-gradient symbol)
5. Cosine similarity loss (diamond shape, merge point)
6. EMA update (dashed arrow from online to target encoder)

Use standard flowchart conventions: rectangles for processes, diamonds
for decisions, cylinders for data stores. Arrows with labels where needed.
Style: clean academic, 3-4 colors max, white background.
Type 3: Encoder-Decoder Framework
The encoder-decoder is the core paradigm for sequence-to-sequence models. Nano Banana Pro can accurately render complex relationships such as information transfer, attention connections, and skip connections between the encoder and decoder.
Prompt Template:
Generate an academic diagram of a U-Net encoder-decoder architecture for
medical image segmentation. Layout: symmetric U-shape.

Left side (Encoder):
- 4 levels of downsampling blocks
- Each block: Conv3×3 → BN → ReLU → Conv3×3 → BN → ReLU → MaxPool
- Feature maps: 64 → 128 → 256 → 512

Bottom (Bottleneck):
- 1024 channels, no pooling

Right side (Decoder):
- 4 levels of upsampling blocks with transposed convolution
- Skip connections: horizontal arrows from encoder to decoder at each level
- Feature maps: 512 → 256 → 128 → 64

Output: 1×1 Conv → Sigmoid → Segmentation mask

Show channel numbers at each level. Use blue for encoder, green for decoder,
gray arrows for skip connections. Clean academic style, labeled components.
Type 4: System Pipeline
System pipeline diagrams show the data processing flow of multi-module systems and the collaborative relationships between modules. This is an indispensable type of methodology figure for papers involving multi-stage systems.
Prompt Template:
Generate a system pipeline diagram for a multimodal RAG system.
Layout: left-to-right, three-stage pipeline.

Stage 1 - Ingestion:
- Document loader (PDF, HTML, images)
- Text extraction + OCR
- Chunking with overlap

Stage 2 - Indexing:
- Text embedding (dense vectors)
- Image embedding (CLIP)
- Vector database (Pinecone/Milvus)

Stage 3 - Retrieval & Generation:
- Query encoder
- Hybrid search (dense + sparse)
- Re-ranker
- LLM generation with retrieved context

Use distinct colored blocks for each stage. Arrows show data flow direction.
Include small icons for document types. Academic style, clean layout.
| Diagram Type | Core Elements | Recommended Layout | Prompt Keywords |
|---|---|---|---|
| Model Architecture | Network layers, feature transforms, module stacking | Left→Right or Top→Bottom | architecture, layers, blocks, flow |
| Algorithm Flowchart | Steps, conditional branches, loops | Top→Bottom with branches | flowchart, steps, branch, decision |
| Encoder-Decoder | Symmetric structure, skip connections, bottleneck | U-shape or Symmetric | encoder, decoder, skip connection |
| System Pipeline | Multi-module, data flow, stage division | Left→Right, multi-stage | pipeline, stages, modules, data flow |
🎯 Technical Advice: The 4 prompt templates above can be used directly via the Nano Banana Pro API on APIYI (apiyi.com). The platform supports OpenAI-compatible formats, and each scientific methodology diagram costs only $0.05—as low as 20% of Google's official pricing. We recommend using the online tool Image.apiyi.com for quick, zero-code verification.
The 3-Stage Workflow for Nano Banana Pro
While generating a methodology diagram with a single prompt is convenient, it often takes several retries to get a perfect result. The industry best practice is to adopt a 3-stage workflow, which is a simplified version of the Planner → Visualizer → Critic collaboration logic used in the PaperBanana framework.
Stage 1: Architect (Planning the Structure)
Before you start generating, clearly define the structure of your methodology diagram in text:
- Component List: List all modules and elements that need to appear.
- Spatial Relationships: Define the relative positions of components (top/bottom, left/right, nested).
- Connections: Clarify arrow directions, solid vs. dashed lines, and skip connections.
- Visual Hierarchy: Decide which are primary components (large size, dark color) and which are auxiliary elements (small size, light color).
This step corresponds to PaperBanana's Planner agent—it transforms the methodology text of a paper into a structured description containing spatial relationships, component layout, and visual hierarchy.
Stage 2: Render (Generating the Image)
Transform that structured description into a prompt for Nano Banana Pro. Key constraints include:
- Layout Constraints: Specify the aspect ratio (3:2 is great for double-column papers) and layout direction.
- Style Constraints: Use terms like "flat vector, academic, clean lines".
- Text Constraints: Use short labels and avoid long sentences.
- Color Constraints: Limit yourself to 3-4 main colors. We suggest "blue: primary, orange: accent, gray: secondary".
Stage 3: Edit (Refining Details)
Nano Banana Pro generates raster images, so you'll need to do some fine-tuning for final publication:
- Replace all text labels in vector software (to ensure fonts and sizes meet journal requirements).
- Check that arrow directions and connection lines are accurate.
- Verify grayscale readability (ensure it's still clear when printed in black and white).
- Unify line weights (it's best to keep them consistent across panels).
- Export as a 300+ dpi PDF/EPS/TIFF format.
Getting Started with Nano Banana Pro for Scientific Diagramming
Minimalist Example: Generating a Transformer Architecture Methodology Diagram
Here's the simplest way to call the API and generate a model architecture methodology diagram:
import openai

client = openai.OpenAI(
    api_key="YOUR_API_KEY",
    base_url="https://vip.apiyi.com/v1"  # 使用 APIYI 统一接口
)

response = client.chat.completions.create(
    model="nano-banana-pro",
    messages=[{
        "role": "user",
        "content": (
            "Generate a clean academic methodology diagram: "
            "Transformer encoder-decoder architecture. "
            "Left: 6× encoder blocks (self-attention + FFN). "
            "Right: 6× decoder blocks (masked self-attention + "
            "cross-attention + FFN). "
            "Arrows: encoder output → decoder cross-attention. "
            "Style: flat vector, academic, blue/gray palette, "
            "labeled components, 3:2 aspect ratio."
        )
    }]
)
print(response.choices[0].message.content)
View the full code for batch scientific methodology diagram generation
import openai
from typing import Optional, List

def generate_methodology_diagram(
    description: str,
    diagram_type: str = "architecture",
    layout: str = "left-to-right",
    palette: str = "blue primary, gray secondary",
    aspect_ratio: str = "3:2"
) -> str:
    """
    使用 Nano Banana Pro 生成科研方法论图

    Args:
        description: 方法论图内容描述
        diagram_type: 图类型 - architecture/flowchart/encoder-decoder/pipeline
        layout: 布局方向 - left-to-right/top-to-bottom/u-shape
        palette: 配色方案
        aspect_ratio: 宽高比

    Returns:
        生成结果
    """
    client = openai.OpenAI(
        api_key="YOUR_API_KEY",
        base_url="https://vip.apiyi.com/v1"  # APIYI统一接口
    )

    layout_hints = {
        "architecture": "Show layer stacking and feature transformations",
        "flowchart": "Use standard flowchart shapes with clear branching",
        "encoder-decoder": "Symmetric layout with skip connections",
        "pipeline": "Multi-stage blocks with data flow arrows"
    }

    prompt = f"""Generate a clean academic methodology diagram.
Type: {diagram_type}
Layout: {layout}
{layout_hints.get(diagram_type, '')}

Description:
{description}

Style constraints:
- Flat vector, academic, clean lines
- Color palette: {palette}
- Aspect ratio: {aspect_ratio}
- Labeled components with short identifiers
- No decorative elements
- White or light background"""

    try:
        response = client.chat.completions.create(
            model="nano-banana-pro",
            messages=[{"role": "user", "content": prompt}],
            max_tokens=4096
        )
        return response.choices[0].message.content
    except Exception as e:
        return f"Error: {str(e)}"

# 示例:批量生成论文中的 3 张方法论图
diagrams = [
    {
        "description": "Vision Transformer: image patches → linear embedding → 12× transformer blocks → classification head",
        "diagram_type": "architecture",
        "layout": "left-to-right"
    },
    {
        "description": "Self-supervised contrastive learning: augmented views → online/target encoders → cosine similarity loss → EMA update",
        "diagram_type": "flowchart",
        "layout": "top-to-bottom"
    },
    {
        "description": "U-Net: 4-level encoder (conv+pool) → bottleneck → 4-level decoder (upconv+concat) with skip connections",
        "diagram_type": "encoder-decoder",
        "layout": "u-shape"
    }
]

for i, d in enumerate(diagrams):
    print(f"--- Generating diagram {i+1}: {d['diagram_type']} ---")
    result = generate_methodology_diagram(**d)
    print(result[:200])
💰 Cost Optimization: By calling the Nano Banana Pro scientific diagramming API via APIYI (apiyi.com), each methodology diagram costs only $0.05—saving nearly 80% compared to Google's official $0.234 pricing. A typical paper usually contains 3-5 methodology diagrams. Using a 3-stage workflow to generate 3-5 candidate versions for each brings the total cost to less than $1. The online tool Image.apiyi.com supports zero-code generation, perfect for quickly testing prompt effectiveness.
7 Key Practices for Nano Banana Pro Scientific Diagramming
Based on PaperBanana evaluation data and community best practices, these 7 tips will significantly improve the quality of your Nano Banana Pro methodology diagrams:
Tip 1: Use Schema Prompts instead of narrative descriptions
Nano Banana Pro responds much better to structured input than natural language narratives. Organize your prompt into a "Component List + Spatial Relationships + Style Constraints" schema format rather than a descriptive paragraph.
Tip 2: Limit the color palette to 3-4 colors
The professional feel of academic illustrations comes from a restrained palette. We recommend using ColorBrewer schemes and avoiding red-green combinations (which aren't colorblind-friendly). Suggested combo: Blue (primary) + Orange (accent) + Gray (background/auxiliary).
Tip 3: Use short identifiers for labels
While Nano Banana Pro has excellent text rendering, long labels can lead to crowded layouts. Use short identifiers like "MHA", "FFN", or "BN", and provide full names in the paper's figure caption.
Tip 4: Generate one panel at a time
If your methodology diagram includes multiple panels (like Figure 1a/1b/1c), generate them separately and assemble them manually rather than asking for a multi-panel layout all at once. Single-panel generation offers significantly higher quality and control.
Tip 5: Specify a clear layout direction
Explicit instructions like "left-to-right flow", "top-to-bottom", or "symmetric U-shape" are much more effective than "clear layout". The layout direction should align with the data flow.
Tip 6: Generate and compare multiple versions
Take advantage of Nano Banana Pro's low cost to generate 3-5 candidate versions for each diagram. Layouts, colors, and label placements will vary between versions, allowing you to pick the best one.
Tip 7: Include an AI-assisted disclosure in your paper
More and more top-tier journals require disclosure of AI tool usage. We suggest noting in the figure caption or methods section: "Schematic generated with Nano-Banana-Pro and edited in [Software Name]". Always check the target journal's AI policy before submission.
| Tip No. | Key Point | Improvement |
|---|---|---|
| 1 | Schema Prompt Format | Structural Clarity +40% |
| 2 | 3-4 Color Palette | Significant Professionalism Boost |
| 3 | Short Identifier Labels | Layout Neatness +30% |
| 4 | Single Panel Generation | Controllability +50% |
| 5 | Clear Layout Direction | First-pass Success Rate +35% |
| 6 | Multi-version Comparison | Final Quality +25% |
| 7 | AI Disclosure | Compliance Assurance |
🎯 Practical Advice: By combining these 7 tips, you can create a publication-quality methodology diagram in under 30 minutes. Calling the API via the APIYI (apiyi.com) platform makes generating batch candidates extremely affordable at just $0.05 per image.
How the Planner and Visualizer Agents Collaborate
Understanding how the Planner and Visualizer agents collaborate within the PaperBanana framework will help you write higher-quality prompts for Nano Banana Pro scientific diagramming.
How the Planner Agent Designs Methodology Diagrams
After receiving the methodology text of a paper, PaperBanana's Planner agent generates a structured "Scene Specification," which includes three core dimensions:
- Component Dimension: Lists all visual elements and their types (rectangles, circles, diamonds, arrows, etc.).
- Spatial Dimension: Defines the relative positions and alignment of elements.
- Hierarchical Dimension: Marks visual weights (using large sizes and dark colors for main modules, and small sizes with light colors for auxiliary elements).
How the Visualizer Agent Renders
The Visualizer agent passes the Planner's Scene Specification into the Nano Banana Pro model to trigger precise rendering. The core advantages of Nano Banana Pro for scientific diagramming include:
- Shape Precision: Sharp edges for geometric shapes like rectangles, rounded rectangles, diamonds, and circles.
- Connector Quality: Correct arrow directions, aligned connection endpoints, and clear distinction between solid and dashed lines.
- Icon Recognition: Ability to generate common scientific icons (database cylinders, cloud icons, GPU icons, etc.).
- Text Placement: Centered labels, appropriate font sizes, and no overlapping with other elements.
| Dimension | Planner Output | Visualizer Rendering |
|---|---|---|
| Components | List of element types and quantities | Precise geometric shapes and icons |
| Space | Relative positions and alignment rules | Logical layout and spacing |
| Hierarchy | Visual weight annotations | Hierarchical distinction via size and color |
| Connections | Arrow directions and line type definitions | Accurate connectors and data flows |
When writing prompts, you can mimic the Planner agent's output format—list the components first, define the space, and finally mark the hierarchy. This structured prompt approach allows Nano Banana Pro to produce more accurate methodology diagrams.
FAQ
Q1: How does the quality of Nano Banana Pro methodology diagrams compare to manual drawing?
In PaperBanana's blind evaluations, methodology diagrams rendered by Nano Banana Pro were preferred by human reviewers 72.7% of the time. It shows significant advantages in conciseness (+37.2%) and readability (+12.9%). However, content fidelity (45.8%) still requires manual verification—especially regarding arrow directions and connector alignment. We recommend fine-tuning key details in vector software after generation. By calling Nano Banana Pro via APIYI (apiyi.com), you can generate multiple candidate versions at a low cost for screening.
Q2: Is it better to use Chinese or English prompts when generating scientific methodology diagrams?
We recommend using English prompts. Nano Banana Pro understands English technical terms more precisely, and the spelling of generated label text is more accurate. If your paper is in Chinese, you can use an English prompt to generate the layout and structure first, then replace the labels with Chinese during the fine-tuning stage. The APIYI (apiyi.com) platform supports both Chinese and English calls, and the online tool Image.apiyi.com also provides a bilingual interface.
Q3: How can I quickly get started with Nano Banana Pro for scientific methodology diagrams?
We recommend the following quick-start path:
- Visit APIYI (apiyi.com) to register an account and get your API Key and free test credits.
- Use the four types of prompt templates provided in this article, replacing the descriptions with your own paper's methodology.
- Or directly visit the online tool Image.apiyi.com and paste your prompt for zero-code diagram generation.
- If you're not satisfied with the results, refer to the seven key practices to adjust your prompt and regenerate.
Summary
Here are the core takeaways for creating methodology figures with Nano Banana Pro:
- Full Coverage of 4 Figure Types: Model architectures, algorithm flowcharts, encoder-decoder frameworks, and system pipelines—covering the primary visual needs of AI papers.
- 3-Stage Workflow: Architect (structure planning) → Render (image generation) → Edit (fine-tuning details). This delivers a significant quality boost over single-prompt attempts.
- Planner-Visualizer Collaboration: Understand the planning-rendering logic of PaperBanana and use Schema prompts to simulate the Planner's output format.
- 7 Key Practices: Schema prompts, limited color palettes, short labels, single-panel layouts, clear positioning, multi-versioning, and AI disclosure.
Nano Banana Pro is shifting scientific diagramming from "hours" to "minutes." While final publications still need a human touch for the fine details, AI has taken over the most time-consuming part: the initial design.
We recommend trying Nano Banana Pro via APIYI (apiyi.com) for quick results—it's only $0.05 per methodology figure. You can also use the no-code tool at Image.apiyi.com to test your prompt effects; the platform offers free credits and OpenAI-compatible interfaces.
📚 References
⚠️ Link Format Note: All external links use the
Resource Name: domain.comformat. This makes them easy to copy while avoiding SEO weight loss from clickable links.
-
PaperBanana Project Homepage: Official release page, including the paper and demo.
- Link:
dwzhu-pku.github.io/PaperBanana/ - Note: Learn about PaperBanana's 5-agent architecture and evaluation results.
- Link:
-
PaperBanana Paper: Full text of the arXiv preprint.
- Link:
arxiv.org/abs/2601.23265 - Note: Deep dive into the Planner-Visualizer collaboration principles and evaluation data from 292 test cases.
- Link:
-
Nano Banana Pro Academic Figure Guide: Professional practices for scientific diagramming.
- Link:
z-image.ai/blog/nano-banana-pro-guide-for-academic-figures - Note: Detailed advice on the 3-stage workflow, color schemes, and resolution settings.
- Link:
-
Nano Banana Pro Official Documentation: Introduction to the Google DeepMind model.
- Link:
deepmind.google/models/gemini-image/pro/ - Note: Understand model technical specs, supported resolutions, and API parameters.
- Link:
-
APIYI Nano Banana Pro Online Generation: No-code scientific diagramming tool.
- Link:
Image.apiyi.com - Note: Generate scientific methodology figures by simply pasting your prompt—no coding required.
- Link:
Author: APIYI Team
Technical Exchange: Feel free to share your methodology figure prompt templates in the comments! For more AI model updates, visit the APIYI (apiyi.com) tech community.