监控 Nano Banana Pro API 可用性是开发者保障图像生成业务稳定运行的关键需求。本文将介绍 3 种实用的 Nano Banana Pro API 监控方法,帮助你实时掌握服务状态,快速响应故障。
核心价值: 读完本文,你将学会使用 Google 官方状态页和 OpenRouter 第三方监控工具,建立完整的 Nano Banana Pro API 可用性监控体系。
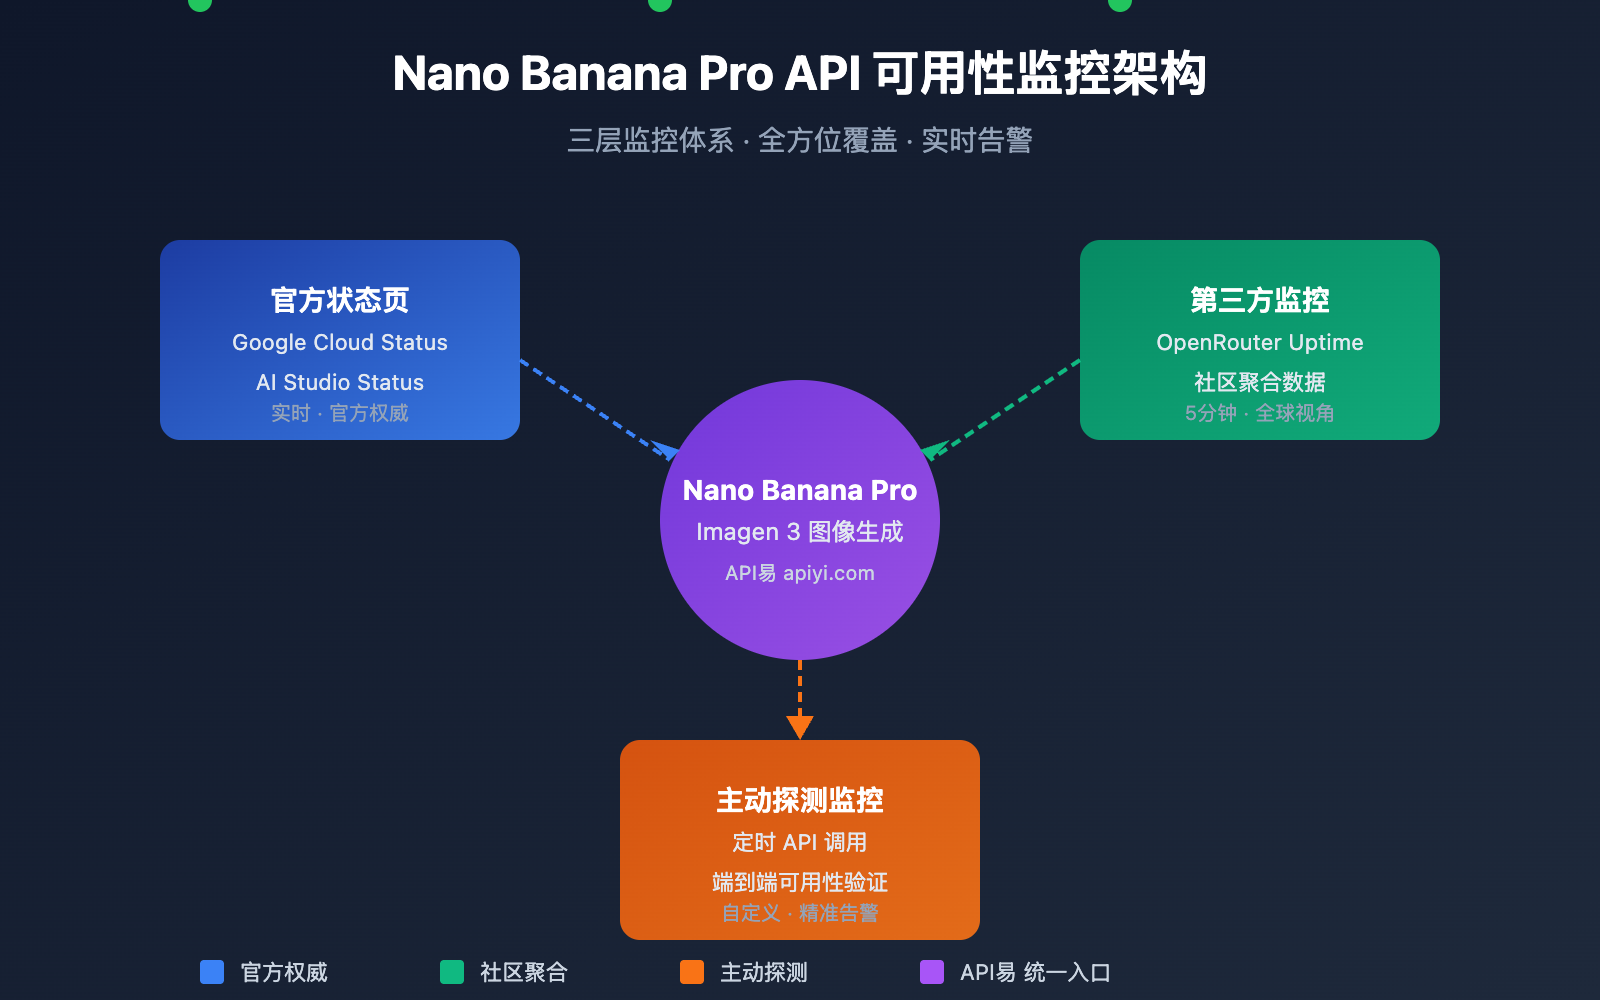
Nano Banana Pro API 监控核心要点
Nano Banana Pro (基于 Google Imagen 3) 是当前最强大的 AI 图像生成模型之一。由于其底层依赖 Google Cloud 基础设施,监控策略需要覆盖多个层面。
| 监控层面 | 监控来源 | 监控内容 | 更新频率 |
|---|---|---|---|
| 基础设施层 | Google Cloud Status | 计算、网络、存储服务 | 实时 |
| AI 服务层 | AI Studio Status | Gemini、Imagen 模型服务 | 实时 |
| 第三方聚合 | OpenRouter Uptime | API 响应率、延迟统计 | 5 分钟 |
| 主动探测 | 自建监控脚本 | 端到端可用性测试 | 自定义 |
Nano Banana Pro API 监控关键指标
监控 Nano Banana Pro API 时,需要关注以下核心指标:
| 指标名称 | 正常范围 | 告警阈值 | 说明 |
|---|---|---|---|
| API 可用率 | ≥ 99.5% | < 99% | 服务整体可用性 |
| 响应延迟 | 5-15 秒 | > 30 秒 | 图像生成耗时 |
| 错误率 | < 1% | > 5% | 请求失败比例 |
| 限流触发 | 0 次/小时 | > 10 次/小时 | Rate Limit 命中 |
🎯 技术建议: 在实际开发中,我们建议通过 API易 apiyi.com 平台进行 Nano Banana Pro API 调用。该平台提供统一的状态监控和告警服务,降低自建监控成本。
Nano Banana Pro API 监控方法一: Google 官方状态页
Google Cloud Status 监控
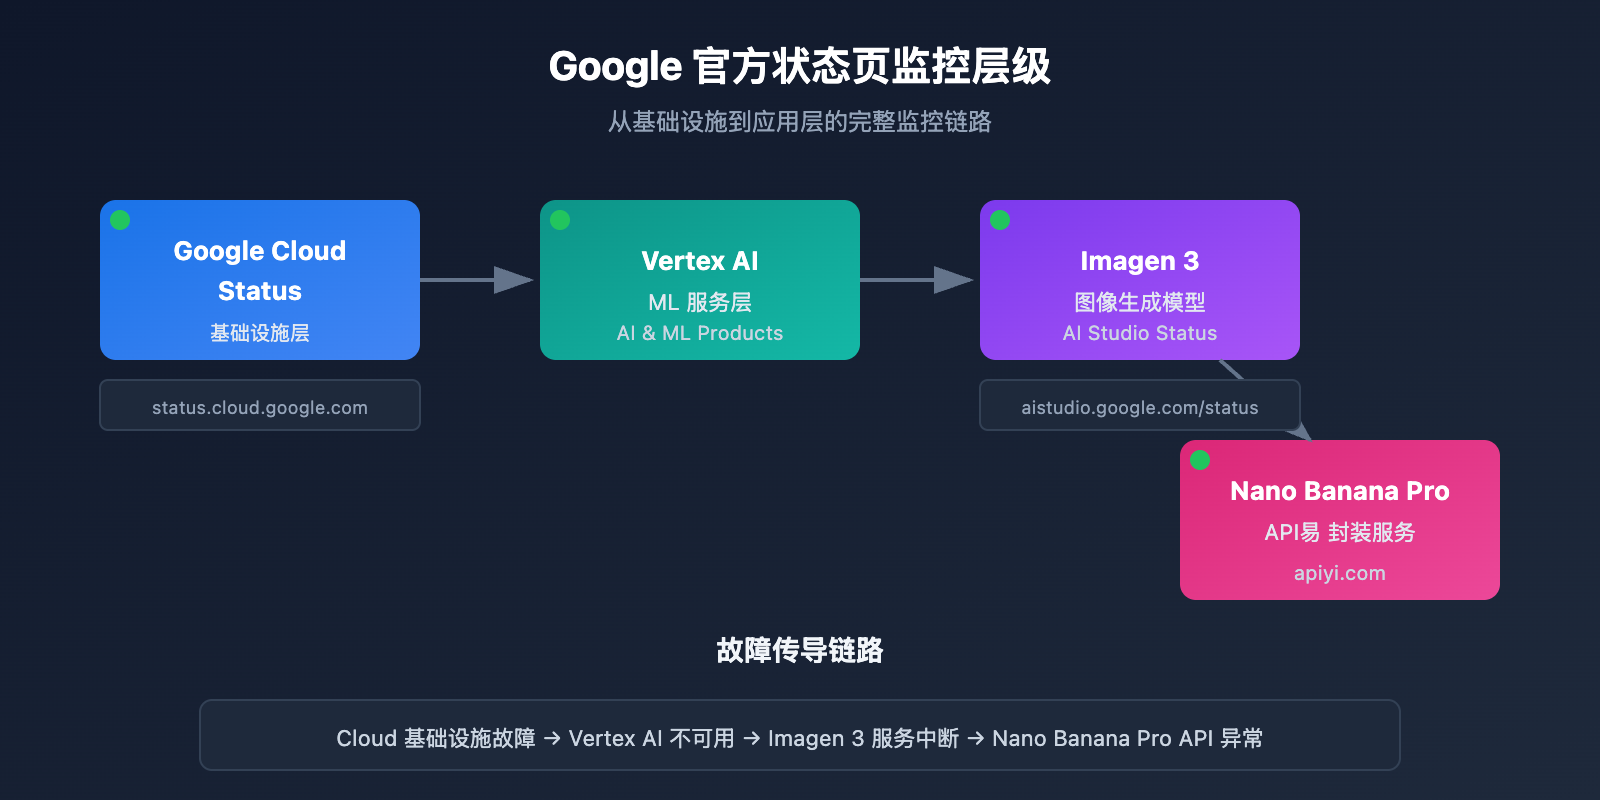
Google Cloud Status 页面提供 Google 基础设施的实时状态信息,是监控 Nano Banana Pro 底层服务的首选来源。
官方状态页地址: status.cloud.google.com
关键监控服务
| 服务名称 | 状态页位置 | 影响范围 |
|---|---|---|
| Vertex AI | AI & Machine Learning | 直接影响 Imagen 3 |
| Cloud Storage | Storage | 影响图像存储和返回 |
| Cloud Run | Compute | 影响 API 网关服务 |
| Cloud Load Balancing | Networking | 影响请求路由 |
状态订阅设置
Google Cloud Status 支持多种订阅方式:
# 示例: 使用 Google Cloud Status API 获取状态
import requests

def check_google_cloud_status():
    """
    检查 Google Cloud 服务状态
    通过 API易 apiyi.com 统一接口调用
    """
    # Google Cloud Status RSS Feed
    status_url = "https://status.cloud.google.com/incidents.json"

    try:
        response = requests.get(status_url, timeout=10)
        incidents = response.json()

        # 筛选 Vertex AI 相关事件
        vertex_incidents = [
            inc for inc in incidents
            if 'Vertex AI' in str(inc.get('affected_products', []))
        ]

        return {
            'status': 'healthy' if not vertex_incidents else 'degraded',
            'incidents': vertex_incidents
        }
    except Exception as e:
        return {'status': 'unknown', 'error': str(e)}

# 执行检查
result = check_google_cloud_status()
print(f"Vertex AI 状态: {result['status']}")
AI Studio Status 监控
Google AI Studio 提供 Gemini 和 Imagen 模型的专属状态页面。
AI Studio 状态页地址: aistudio.google.com/status
| 监控项 | 说明 | 检查频率 |
|---|---|---|
| Gemini Models | 文本生成模型状态 | 实时 |
| Imagen Models | 图像生成模型状态 | 实时 |
| API Quota | 配额使用情况 | 每小时 |
| Regional Status | 各区域服务状态 | 实时 |
查看 AI Studio 状态监控完整代码
import requests
from datetime import datetime, timedelta
import json

class AIStudioMonitor:
    """
    AI Studio 状态监控类
    适用于监控 Nano Banana Pro (Imagen 3) 服务状态
    """

    def __init__(self, api_key: str):
        self.api_key = api_key
        # 使用 API易 统一接口
        self.base_url = "https://api.apiyi.com/v1"
        self.status_history = []

    def check_imagen_health(self) -> dict:
        """
        通过实际 API 调用检测 Imagen 3 服务健康状态
        """
        try:
            headers = {
                "Authorization": f"Bearer {self.api_key}",
                "Content-Type": "application/json"
            }

            # 发送轻量级测试请求
            test_payload = {
                "model": "nano-banana-pro",
                "prompt": "health check test",
                "n": 1,
                "size": "256x256"  # 最小尺寸减少成本
            }

            start_time = datetime.now()
            response = requests.post(
                f"{self.base_url}/images/generations",
                headers=headers,
                json=test_payload,
                timeout=60
            )
            latency = (datetime.now() - start_time).total_seconds()

            if response.status_code == 200:
                return {
                    'status': 'healthy',
                    'latency': latency,
                    'timestamp': datetime.now().isoformat()
                }
            elif response.status_code == 429:
                return {
                    'status': 'rate_limited',
                    'latency': latency,
                    'timestamp': datetime.now().isoformat()
                }
            else:
                return {
                    'status': 'degraded',
                    'error_code': response.status_code,
                    'timestamp': datetime.now().isoformat()
                }

        except requests.Timeout:
            return {
                'status': 'timeout',
                'timestamp': datetime.now().isoformat()
            }
        except Exception as e:
            return {
                'status': 'error',
                'error': str(e),
                'timestamp': datetime.now().isoformat()
            }

    def get_uptime_stats(self, hours: int = 24) -> dict:
        """
        计算过去 N 小时的可用性统计
        """
        cutoff = datetime.now() - timedelta(hours=hours)
        recent_checks = [
            s for s in self.status_history
            if datetime.fromisoformat(s['timestamp']) > cutoff
        ]

        if not recent_checks:
            return {'uptime': 'N/A', 'sample_count': 0}

        healthy_count = sum(1 for s in recent_checks if s['status'] == 'healthy')
        uptime_pct = (healthy_count / len(recent_checks)) * 100

        return {
            'uptime': f"{uptime_pct:.2f}%",
            'sample_count': len(recent_checks),
            'healthy_count': healthy_count,
            'period_hours': hours
        }

# 使用示例
monitor = AIStudioMonitor(api_key="your-apiyi-key")
health = monitor.check_imagen_health()
print(f"Nano Banana Pro 健康状态: {health}")
💡 选择建议: 选择监控方案主要取决于您的具体需求。我们建议通过 API易 apiyi.com 平台进行 API 调用测试,该平台提供内置的状态监控面板,便于快速查看服务可用性。
Nano Banana Pro API 监控方法二: OpenRouter 第三方监控
OpenRouter 提供专业的第三方 AI 模型监控服务,是监控 Nano Banana Pro API 可用性的重要补充。
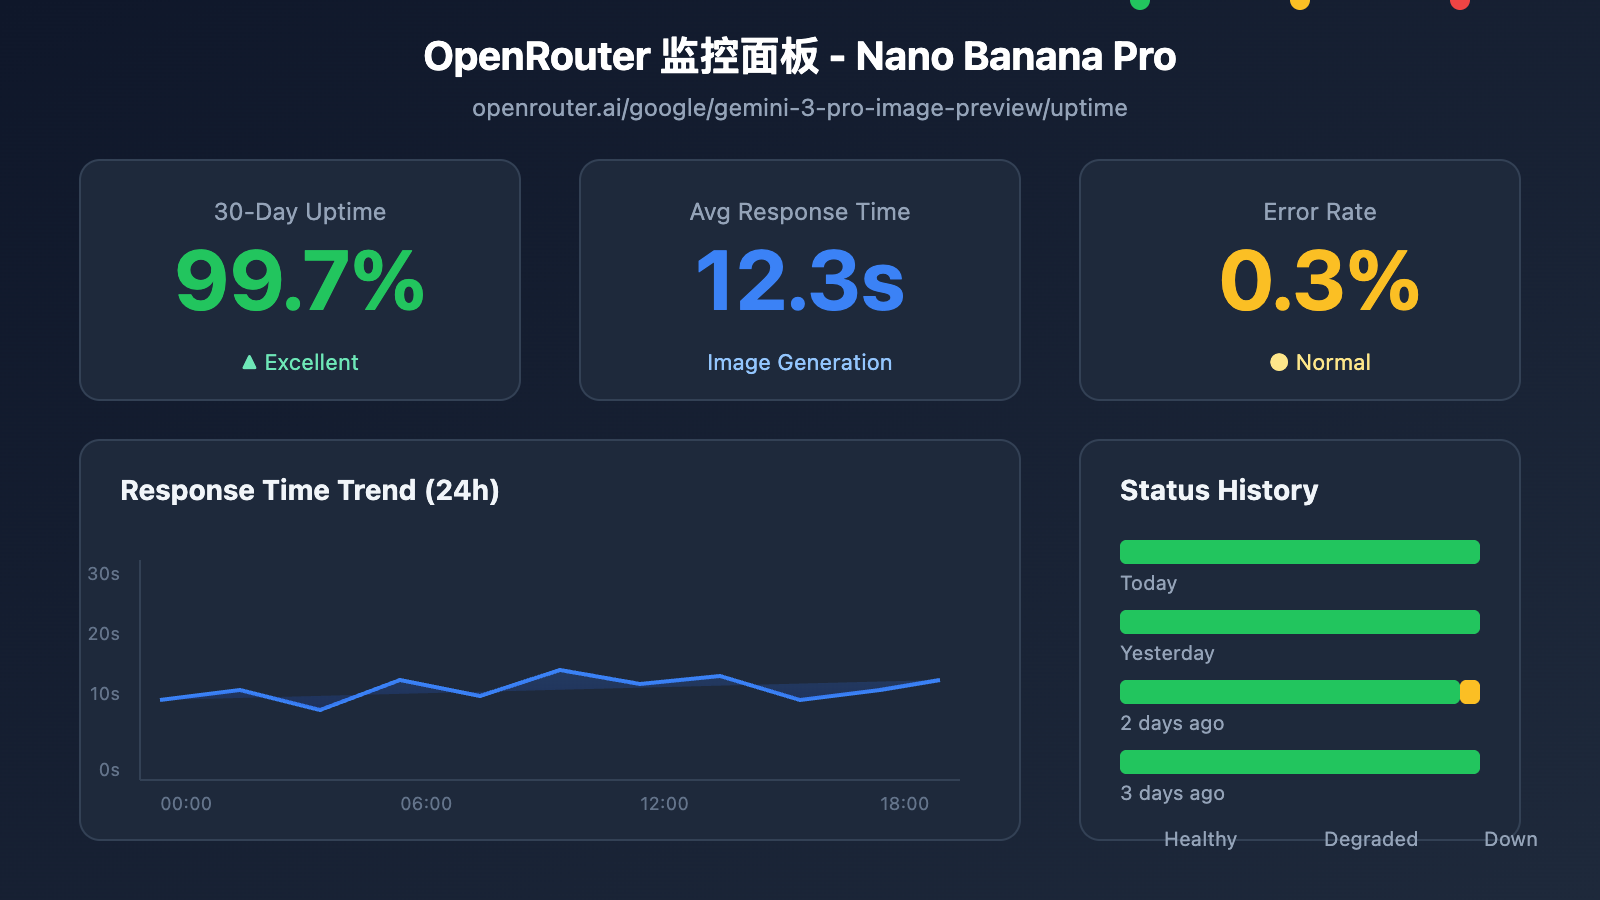
OpenRouter Uptime 监控页面
Nano Banana Pro 监控地址: openrouter.ai/google/gemini-3-pro-image-preview/uptime
OpenRouter 监控数据解读
| 数据指标 | 含义 | 参考值 |
|---|---|---|
| Uptime % | 过去 30 天可用性 | ≥ 99% 为优秀 |
| Avg Latency | 平均响应延迟 | 图像生成 10-20s 正常 |
| P95 Latency | 95% 请求延迟 | < 30s 为正常 |
| Error Rate | 请求错误率 | < 2% 为健康 |
| Throughput | 请求吞吐量 | 反映模型热度 |
监控数据获取脚本
import requests
from bs4 import BeautifulSoup
import json

def get_openrouter_uptime(model_id: str = "google/gemini-3-pro-image-preview"):
    """
    获取 OpenRouter 模型可用性数据
    适用于 Nano Banana Pro (Imagen 3) 监控
    """
    uptime_url = f"https://openrouter.ai/{model_id}/uptime"

    # 注意: OpenRouter 可能需要 API 调用获取详细数据
    # 这里展示基本的可用性检查思路

    try:
        # 通过 OpenRouter API 获取模型信息
        api_url = "https://openrouter.ai/api/v1/models"
        response = requests.get(api_url, timeout=10)
        models = response.json().get('data', [])

        # 查找目标模型
        target_model = next(
            (m for m in models if m.get('id') == model_id),
            None
        )

        if target_model:
            return {
                'model_id': model_id,
                'status': 'available' if target_model else 'unknown',
                'pricing': target_model.get('pricing', {}),
                'context_length': target_model.get('context_length'),
                'uptime_url': uptime_url
            }
        else:
            return {
                'model_id': model_id,
                'status': 'not_found',
                'uptime_url': uptime_url
            }

    except Exception as e:
        return {
            'model_id': model_id,
            'status': 'error',
            'error': str(e)
        }

# 检查 Nano Banana Pro 状态
nano_status = get_openrouter_uptime()
print(json.dumps(nano_status, indent=2))
多模型对比监控
通过 OpenRouter 可以同时监控多个图像生成模型的状态:
| 模型 | OpenRouter ID | 监控价值 |
|---|---|---|
| Nano Banana Pro | google/gemini-3-pro-image-preview | 主要监控目标 |
| DALL-E 3 | openai/dall-e-3 | 备选方案状态 |
| Stable Diffusion 3 | stabilityai/stable-diffusion-3 | 备选方案状态 |
| Midjourney | – | 暂不支持 API |
🚀 快速开始: 推荐使用 API易 apiyi.com 平台快速搭建图像生成原型。该平台提供开箱即用的多模型切换能力,当主模型不可用时可自动切换备选模型。
Nano Banana Pro API 监控方法三: 主动探测监控
除了被动订阅状态页,主动探测是确保业务稳定的关键手段。
定时探测脚本
import openai
import time
import json
from datetime import datetime
import schedule

# 使用 API易 统一接口
client = openai.OpenAI(
    api_key="your-apiyi-key",
    base_url="https://api.apiyi.com/v1"
)

class NanoBananaProMonitor:
    """
    Nano Banana Pro API 主动探测监控
    """

    def __init__(self):
        self.check_results = []
        self.alert_threshold = 3  # 连续失败 3 次触发告警
        self.consecutive_failures = 0

    def health_check(self) -> dict:
        """
        执行一次健康检查
        """
        start_time = time.time()

        try:
            response = client.images.generate(
                model="nano-banana-pro",
                prompt="A simple red circle on white background",
                n=1,
                size="256x256"
            )

            latency = time.time() - start_time

            result = {
                'timestamp': datetime.now().isoformat(),
                'status': 'success',
                'latency': round(latency, 2),
                'model': 'nano-banana-pro'
            }

            self.consecutive_failures = 0

        except openai.RateLimitError:
            result = {
                'timestamp': datetime.now().isoformat(),
                'status': 'rate_limited',
                'latency': time.time() - start_time,
                'model': 'nano-banana-pro'
            }
            # Rate limit 不计入失败

        except openai.APIError as e:
            result = {
                'timestamp': datetime.now().isoformat(),
                'status': 'api_error',
                'error': str(e),
                'model': 'nano-banana-pro'
            }
            self.consecutive_failures += 1

        except Exception as e:
            result = {
                'timestamp': datetime.now().isoformat(),
                'status': 'error',
                'error': str(e),
                'model': 'nano-banana-pro'
            }
            self.consecutive_failures += 1

        self.check_results.append(result)

        # 检查是否需要告警
        if self.consecutive_failures >= self.alert_threshold:
            self.send_alert(result)

        return result

    def send_alert(self, result: dict):
        """
        发送告警通知
        可对接: 企业微信、钉钉、飞书、Slack、邮件等
        """
        alert_message = f"""
        🚨 Nano Banana Pro API 告警

        状态: {result.get('status')}
        时间: {result.get('timestamp')}
        错误: {result.get('error', 'N/A')}
        连续失败: {self.consecutive_failures} 次
        """

        print(alert_message)
        # 实际项目中对接通知渠道
        # self.send_wechat(alert_message)
        # self.send_feishu(alert_message)

    def get_statistics(self, hours: int = 24) -> dict:
        """
        获取监控统计数据
        """
        from datetime import timedelta

        cutoff = datetime.now() - timedelta(hours=hours)
        recent = [
            r for r in self.check_results
            if datetime.fromisoformat(r['timestamp']) > cutoff
        ]

        if not recent:
            return {'message': 'No data available'}

        success_count = sum(1 for r in recent if r['status'] == 'success')
        total_count = len(recent)

        latencies = [r['latency'] for r in recent if 'latency' in r and r['status'] == 'success']
        avg_latency = sum(latencies) / len(latencies) if latencies else 0

        return {
            'period_hours': hours,
            'total_checks': total_count,
            'success_count': success_count,
            'uptime_percentage': round((success_count / total_count) * 100, 2),
            'avg_latency': round(avg_latency, 2),
            'last_check': recent[-1] if recent else None
        }

# 创建监控实例
monitor = NanoBananaProMonitor()

# 设置定时任务: 每 5 分钟检查一次
schedule.every(5).minutes.do(monitor.health_check)

# 运行监控 (生产环境使用)
# while True:
#     schedule.run_pending()
#     time.sleep(1)

# 单次检查示例
result = monitor.health_check()
print(json.dumps(result, indent=2, ensure_ascii=False))
查看完整监控系统代码 (含告警对接)
import openai
import requests
import time
import json
import schedule
import threading
from datetime import datetime, timedelta
from typing import Optional, List, Dict
from dataclasses import dataclass, asdict
from enum import Enum

class AlertChannel(Enum):
    FEISHU = "feishu"
    WECHAT = "wechat"
    DINGTALK = "dingtalk"
    SLACK = "slack"
    EMAIL = "email"

@dataclass
class CheckResult:
    timestamp: str
    status: str
    latency: Optional[float] = None
    error: Optional[str] = None
    model: str = "nano-banana-pro"

@dataclass
class AlertConfig:
    enabled: bool = True
    channels: List[AlertChannel] = None
    threshold: int = 3
    cooldown_minutes: int = 30
    webhook_urls: Dict[str, str] = None

class EnterpriseMonitor:
    """
    企业级 Nano Banana Pro API 监控系统
    支持多通道告警、数据持久化、监控面板
    """

    def __init__(
        self,
        api_key: str,
        base_url: str = "https://api.apiyi.com/v1",
        alert_config: Optional[AlertConfig] = None
    ):
        self.client = openai.OpenAI(
            api_key=api_key,
            base_url=base_url
        )
        self.alert_config = alert_config or AlertConfig()
        self.check_results: List[CheckResult] = []
        self.consecutive_failures = 0
        self.last_alert_time: Optional[datetime] = None
        self._lock = threading.Lock()

    def health_check(self) -> CheckResult:
        """
        执行健康检查
        """
        start_time = time.time()

        try:
            response = self.client.images.generate(
                model="nano-banana-pro",
                prompt="health check: simple geometric shape",
                n=1,
                size="256x256"
            )

            latency = time.time() - start_time
            result = CheckResult(
                timestamp=datetime.now().isoformat(),
                status="success",
                latency=round(latency, 2)
            )

            with self._lock:
                self.consecutive_failures = 0

        except openai.RateLimitError:
            result = CheckResult(
                timestamp=datetime.now().isoformat(),
                status="rate_limited",
                latency=round(time.time() - start_time, 2)
            )

        except openai.APIError as e:
            result = CheckResult(
                timestamp=datetime.now().isoformat(),
                status="api_error",
                error=str(e)
            )
            with self._lock:
                self.consecutive_failures += 1

        except Exception as e:
            result = CheckResult(
                timestamp=datetime.now().isoformat(),
                status="error",
                error=str(e)
            )
            with self._lock:
                self.consecutive_failures += 1

        with self._lock:
            self.check_results.append(result)

            # 保留最近 1000 条记录
            if len(self.check_results) > 1000:
                self.check_results = self.check_results[-1000:]

        # 检查告警条件
        self._check_alert(result)

        return result

    def _check_alert(self, result: CheckResult):
        """
        检查是否需要发送告警
        """
        if not self.alert_config.enabled:
            return

        if self.consecutive_failures < self.alert_config.threshold:
            return

        # 检查告警冷却
        if self.last_alert_time:
            cooldown = timedelta(minutes=self.alert_config.cooldown_minutes)
            if datetime.now() - self.last_alert_time < cooldown:
                return

        self._send_alerts(result)
        self.last_alert_time = datetime.now()

    def _send_alerts(self, result: CheckResult):
        """
        发送多通道告警
        """
        message = self._format_alert_message(result)

        if not self.alert_config.webhook_urls:
            print(f"[ALERT] {message}")
            return

        for channel, webhook_url in self.alert_config.webhook_urls.items():
            try:
                if channel == "feishu":
                    self._send_feishu_alert(webhook_url, message)
                elif channel == "wechat":
                    self._send_wechat_alert(webhook_url, message)
                elif channel == "dingtalk":
                    self._send_dingtalk_alert(webhook_url, message)
                elif channel == "slack":
                    self._send_slack_alert(webhook_url, message)
            except Exception as e:
                print(f"Failed to send {channel} alert: {e}")

    def _format_alert_message(self, result: CheckResult) -> str:
        """
        格式化告警消息
        """
        return f"""
🚨 Nano Banana Pro API 异常告警

📊 状态详情:
• 状态: {result.status}
• 时间: {result.timestamp}
• 错误: {result.error or 'N/A'}
• 连续失败: {self.consecutive_failures} 次

🔗 监控来源:
• Google Cloud Status: status.cloud.google.com
• OpenRouter Uptime: openrouter.ai/google/gemini-3-pro-image-preview/uptime
• API易 监控: apiyi.com

⚡ 建议操作:
1. 检查 Google Cloud 状态页
2. 验证 API 密钥是否有效
3. 检查网络连接状态
4. 联系 API易 技术支持
        """.strip()

    def _send_feishu_alert(self, webhook_url: str, message: str):
        """飞书机器人告警"""
        payload = {
            "msg_type": "text",
            "content": {"text": message}
        }
        requests.post(webhook_url, json=payload, timeout=10)

    def _send_wechat_alert(self, webhook_url: str, message: str):
        """企业微信机器人告警"""
        payload = {
            "msgtype": "text",
            "text": {"content": message}
        }
        requests.post(webhook_url, json=payload, timeout=10)

    def _send_dingtalk_alert(self, webhook_url: str, message: str):
        """钉钉机器人告警"""
        payload = {
            "msgtype": "text",
            "text": {"content": message}
        }
        requests.post(webhook_url, json=payload, timeout=10)

    def _send_slack_alert(self, webhook_url: str, message: str):
        """Slack 机器人告警"""
        payload = {"text": message}
        requests.post(webhook_url, json=payload, timeout=10)

    def get_dashboard_data(self) -> dict:
        """
        获取监控面板数据
        """
        now = datetime.now()

        # 计算不同时间段统计
        periods = {
            '1h': timedelta(hours=1),
            '6h': timedelta(hours=6),
            '24h': timedelta(hours=24),
            '7d': timedelta(days=7)
        }

        stats = {}
        for period_name, delta in periods.items():
            cutoff = now - delta
            recent = [
                r for r in self.check_results
                if datetime.fromisoformat(r.timestamp) > cutoff
            ]

            if recent:
                success = sum(1 for r in recent if r.status == 'success')
                latencies = [r.latency for r in recent if r.latency]

                stats[period_name] = {
                    'total': len(recent),
                    'success': success,
                    'uptime': round((success / len(recent)) * 100, 2),
                    'avg_latency': round(sum(latencies) / len(latencies), 2) if latencies else None
                }
            else:
                stats[period_name] = None

        return {
            'model': 'nano-banana-pro',
            'current_status': self.check_results[-1].status if self.check_results else 'unknown',
            'consecutive_failures': self.consecutive_failures,
            'statistics': stats,
            'last_update': now.isoformat()
        }

# 使用示例
if __name__ == "__main__":
    # 配置告警
    alert_config = AlertConfig(
        enabled=True,
        threshold=3,
        cooldown_minutes=30,
        webhook_urls={
            "feishu": "https://open.feishu.cn/open-apis/bot/v2/hook/xxx",
            # "wechat": "https://qyapi.weixin.qq.com/cgi-bin/webhook/send?key=xxx",
        }
    )

    # 创建监控实例
    monitor = EnterpriseMonitor(
        api_key="your-apiyi-key",
        base_url="https://api.apiyi.com/v1",
        alert_config=alert_config
    )

    # 执行检查
    result = monitor.health_check()
    print("检查结果:", asdict(result))

    # 获取面板数据
    dashboard = monitor.get_dashboard_data()
    print("面板数据:", json.dumps(dashboard, indent=2, ensure_ascii=False))
Nano Banana Pro API 监控告警配置
告警通道对接
| 通道 | Webhook 格式 | 适用场景 |
|---|---|---|
| 飞书 | open.feishu.cn/open-apis/bot/v2/hook/xxx | 国内企业首选 |
| 企业微信 | qyapi.weixin.qq.com/cgi-bin/webhook/send | 微信生态用户 |
| 钉钉 | oapi.dingtalk.com/robot/send | 阿里系企业 |
| Slack | hooks.slack.com/services/xxx | 海外团队 |
| 邮件 | SMTP 配置 | 正式记录 |
告警级别定义
# 告警级别配置
ALERT_LEVELS = {
    'info': {
        'triggers': ['rate_limited'],
        'channels': ['log'],
        'color': '#36a64f'
    },
    'warning': {
        'triggers': ['timeout', 'degraded'],
        'channels': ['feishu', 'slack'],
        'color': '#ff9800'
    },
    'critical': {
        'triggers': ['api_error', 'error'],
        'channels': ['feishu', 'wechat', 'slack', 'email'],
        'color': '#f44336'
    }
}
💰 成本优化: 对于预算敏感的项目,可以考虑通过 API易 apiyi.com 平台调用 Nano Banana Pro API。该平台提供灵活的计费方式和内置监控功能,降低自建监控成本。
Nano Banana Pro API 监控最佳实践
监控策略组合
根据业务重要性,选择合适的监控策略组合:
| 业务级别 | 官方状态页 | 第三方监控 | 主动探测 | 告警通道 |
|---|---|---|---|---|
| 核心业务 | ✅ 订阅 | ✅ OpenRouter | ✅ 1分钟 | 多通道 |
| 重要业务 | ✅ 订阅 | ✅ OpenRouter | ✅ 5分钟 | 飞书+邮件 |
| 普通业务 | ✅ 订阅 | 可选 | ✅ 15分钟 | 飞书 |
| 测试环境 | 可选 | – | ✅ 30分钟 | 日志 |
故障响应流程
检测到异常
    ↓
确认影响范围 (生产/测试)
    ↓
检查官方状态页
    ↓
├── 官方确认故障 → 等待恢复 + 通知用户
├── 官方正常 → 检查自身配置
│   ├── API Key 有效性
│   ├── 配额使用情况
│   ├── 网络连接状态
│   └── 请求参数合规性
└── 无法确定 → 联系技术支持
监控数据分析
import pandas as pd
from datetime import datetime, timedelta

def analyze_monitoring_data(check_results: list) -> dict:
    """
    分析监控数据,生成报告
    """
    df = pd.DataFrame(check_results)
    df['timestamp'] = pd.to_datetime(df['timestamp'])

    # 按小时统计
    df['hour'] = df['timestamp'].dt.floor('H')
    hourly_stats = df.groupby('hour').agg({
        'status': lambda x: (x == 'success').mean() * 100,
        'latency': 'mean'
    }).rename(columns={
        'status': 'uptime_pct',
        'latency': 'avg_latency'
    })

    # 识别异常时段
    anomalies = hourly_stats[hourly_stats['uptime_pct'] < 99]

    # 延迟趋势
    df['date'] = df['timestamp'].dt.date
    daily_latency = df.groupby('date')['latency'].mean()

    return {
        'hourly_stats': hourly_stats.to_dict(),
        'anomaly_periods': anomalies.index.tolist(),
        'daily_latency_trend': daily_latency.to_dict(),
        'overall_uptime': df[df['status'] == 'success'].shape[0] / len(df) * 100
    }
常见问题
Q1: Nano Banana Pro API 监控频率设置多少合适?
监控频率取决于业务重要性:
- 核心生产环境: 建议 1-2 分钟检查一次
- 重要业务: 5 分钟检查一次
- 普通业务: 10-15 分钟检查一次
通过 API易 apiyi.com 平台可以获取免费测试额度,快速验证监控方案可行性。注意平衡监控成本和响应速度。
Q2: 如何区分 Nano Banana Pro 临时波动和真正故障?
建议采用以下策略:
- 连续失败阈值: 设置连续 3 次以上失败才触发告警
- 滑动窗口: 5 分钟内失败率超过 50% 才认定故障
- 多源验证: 同时检查官方状态页确认是否官方故障
- 排除 Rate Limit: 限流不等于故障
通过 API易 apiyi.com 平台的监控面板,可以直观查看历史可用性趋势,快速判断是否为系统性故障。
Q3: OpenRouter 第三方监控数据可靠吗?
OpenRouter 作为知名的 AI 模型聚合平台,其监控数据具有参考价值:
- 优势: 聚合全球用户请求数据,样本量大
- 局限: 可能包含 OpenRouter 自身链路问题
- 建议: 结合官方状态页和自建监控综合判断
Q4: 监控告警太多导致疲劳怎么办?
告警疲劳是常见问题,建议:
- 设置告警级别: 区分 Info、Warning、Critical
- 配置冷却时间: 同一问题 30 分钟内只告警一次
- 聚合告警: 相似问题合并为一条告警
- 告警抑制: 维护期间临时关闭告警
- 持续优化: 定期回顾误报,调整阈值
总结
Nano Banana Pro API 可用性监控是保障图像生成业务稳定的关键环节。本文介绍了 3 种实用监控方法:
- Google 官方状态页: 监控 Cloud Status 和 AI Studio Status,获取第一手官方信息
- OpenRouter 第三方监控: 利用 openrouter.ai 的 Uptime 页面获取社区级可用性数据
- 主动探测监控: 通过定时 API 调用实现端到端可用性验证
推荐通过 API易 apiyi.com 快速验证监控方案效果,该平台提供统一的 API 接口和内置监控面板,帮助开发者降低运维成本。
作者: APIYI 技术团队
技术交流: 欢迎访问 API易 apiyi.com 获取更多 AI API 使用技巧和最佳实践
更新日期: 2026-01-28
相关资源
| 资源类型 | 说明 |
|---|---|
| Google Cloud Status | status.cloud.google.com |
| AI Studio Status | aistudio.google.com/status |
| OpenRouter Uptime | openrouter.ai/google/gemini-3-pro-image-preview/uptime |
| API易 官网 | apiyi.com |