作者注:詳解如何用 Nano Banana Pro 生成科研機制圖、通路圖、實驗流程圖等學術插圖,附完整提示詞模板和 API 調用代碼,通過 API易平臺僅需 $0.05/張。
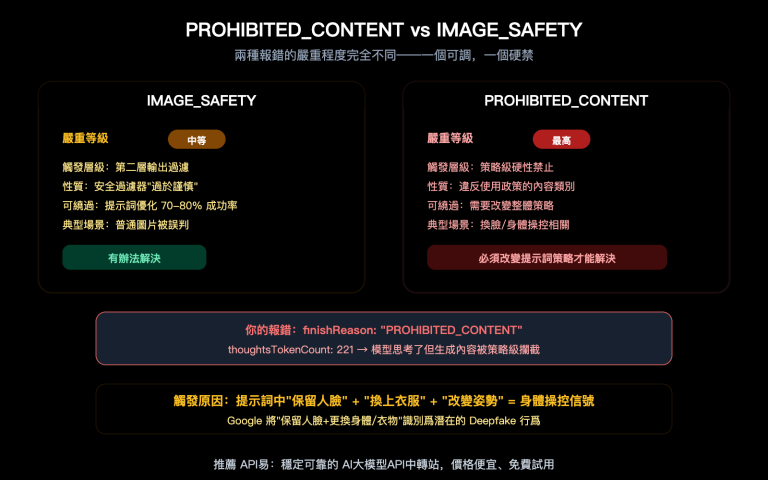
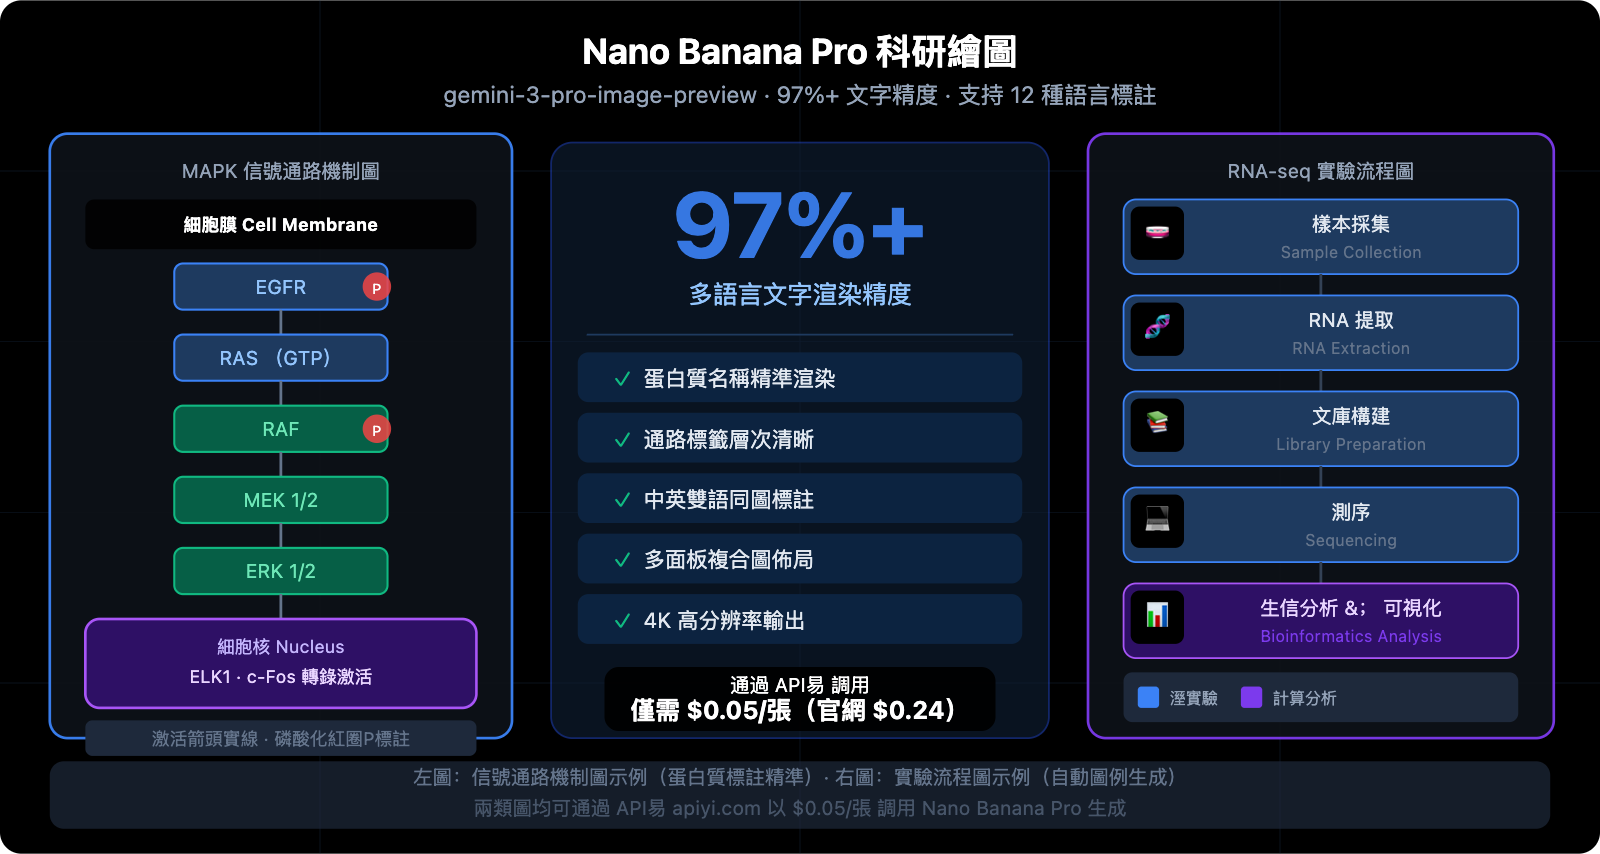
畫一張 SCI 論文配圖,過去要花幾天找設計師或者自己手動用 BioRender 拼圖。現在,Nano Banana Pro 可以直接根據文字描述生成包含精準標註的科研機制圖——文字渲染準確率達 97%+,蛋白質名稱、通路標籤、雙語註釋全部正確渲染,不再出現亂碼。
核心價值:讀完本文,你將掌握 5 類科研繪圖場景的完整提示詞模板,以及通過 API易 以 $0.05/張調用 Nano Banana Pro API 批量生成的完整代碼。
Nano Banana Pro 科研繪圖核心能力
| 能力維度 | 表現 | 科研價值 |
|---|---|---|
| 多語言文字渲染 | 97%+ 精度,12 種語言 | 蛋白質名稱、通路標籤精準無亂碼 |
| 科學標註理解 | 深度訓練於學術文獻和教材 | 能理解 MAPK、PI3K 等專業術語 |
| 多面板構圖 | 支持複合圖佈局與視覺層次 | 直接生成論文 Figure 1 格式 |
| 高分辨率輸出 | 1K / 2K / 4K 三檔 | 滿足期刊投稿圖像質量要求 |
| 文字嵌入圖像 | 自動生成標註塊、圖例 | 省去後期 PS 添字步驟 |
爲什麼科研繪圖首選 Nano Banana Pro?
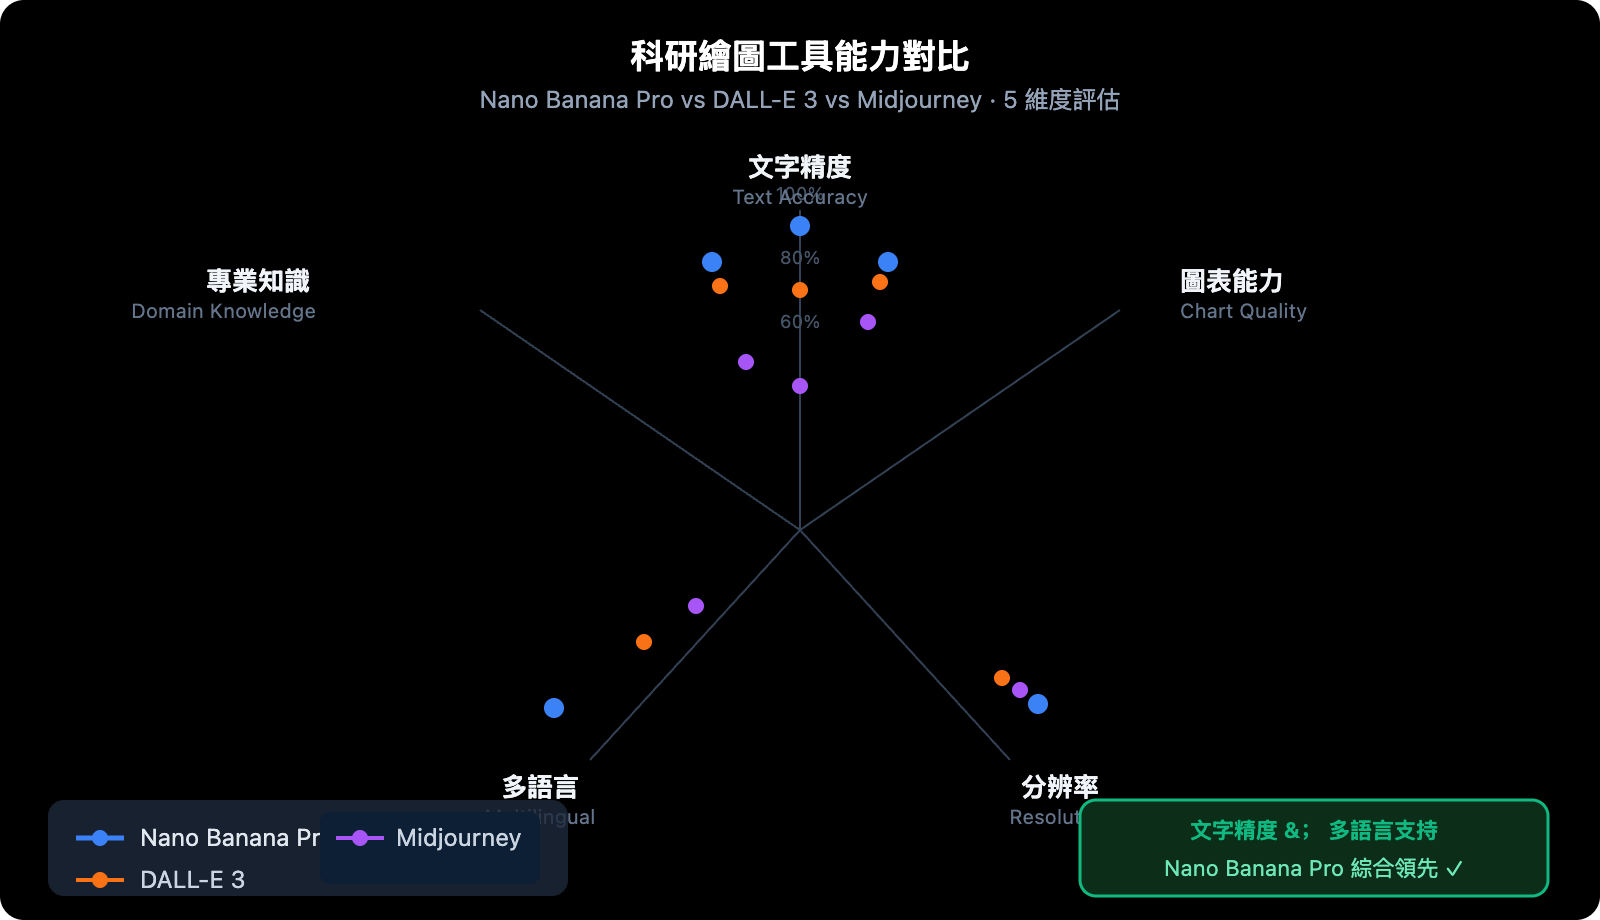
科研圖表對 AI 圖像工具提出了極高要求:不僅要畫面美觀,更要文字標註精準、專業術語正確、信息層次清晰。這正是 Nano Banana Pro 相比其他工具的決定性優勢。
對比同類工具:DALL-E 3 在解剖圖真實感上略勝,但處理含大量科學標註的複合圖時文字經常出錯;Midjourney 擅長藝術風格但標註能力弱;Adobe Firefly 偏向商業設計場景。Nano Banana Pro 是目前唯一一款在科學文字渲染 + 專業知識理解上同時達到高水準的 AI 圖像模型。
Google 還基於同一套模型推出了 PaperBanana 框架——專爲從方法論描述文本自動生成學術插圖而設計,在 NeurIPS 2025 的 584 份樣本中進行了系統測試,可見其在學術場景的戰略定位。
5 類科研繪圖場景與提示詞模板
場景一:細胞信號通路機制圖
適用場景:細胞生物學、分子生物學論文,展示信號級聯、蛋白質磷酸化通路。
提示詞模板:
Create a scientific mechanism diagram illustrating the MAPK/ERK signaling pathway.
Style: Clean white background academic illustration, suitable for SCI publication.
Layout: Vertical cascade flow from top (receptor) to bottom (nucleus).
Elements:
- Cell membrane at top with RTK receptor labeled "EGFR"
- Signal cascade: RAS → RAF → MEK → ERK with phosphorylation arrows
- Each protein shown as rounded rectangle with proper label
- Arrow styles: solid for activation, dashed for inhibition
- Nucleus at bottom with transcription factor labeled "ELK1"
Colors: Blue for membrane proteins, green for cytoplasmic kinases, red for nuclear targets
Text: All labels in English, 12pt equivalent, clearly legible
Resolution: 4K, aspect ratio 3:4
中文簡化版提示詞:
繪製 MAPK/ERK 信號通路機制圖,學術論文插圖風格,白色背景。
從上到下縱向排列:細胞膜(含 EGFR 受體)→ RAS → RAF → MEK → ERK → 細胞核(ELK1)。
每個蛋白質用圓角矩形表示,標註清晰,激活箭頭實線,抑制箭頭虛線。
藍色膜蛋白,綠色胞質激酶,紅色核轉錄因子。4K 分辨率,3:4 比例。
💡 提示:對於分子通路圖,建議在提示詞中明確指定每個節點的蛋白質名稱,Nano Banana Pro 會正確渲染專業術語。通過 API易 apiyi.com 調用,每張 4K 通路圖僅需 $0.05,批量生成多個通路變體成本極低。
場景二:實驗流程圖(Experimental Workflow)
適用場景:方法論章節,展示實驗步驟、樣本處理流程、儀器操作序列。
提示詞模板:
Design a scientific experimental workflow diagram for RNA-seq analysis pipeline.
Style: Professional flowchart, dark blue background (#0f172a), white and light blue elements.
Steps (left to right, 6 steps):
1. "Sample Collection" - test tube icon
2. "RNA Extraction" - spiral RNA icon
3. "Library Preparation" - fragment icons
4. "Sequencing" - chip/sequencer icon
5. "Bioinformatics Analysis" - computer/code icon
6. "Data Visualization" - chart icon
Each step: rounded rectangle box, icon above, step name below, connected by arrows
Color coding: wet lab steps in blue, computational steps in purple
Add percentage labels for typical time allocation at each step
4K resolution, 16:9 aspect ratio, publication quality
場景三:細胞生物學結構插圖
適用場景:教學材料、綜述論文,展示細胞器結構、組織解剖、亞細胞定位。
提示詞模板:
Create a detailed cell biology illustration showing mitochondrial structure and function.
Style: Scientific textbook illustration, clean white background.
Main elements:
- Cross-section view of mitochondrion (oval shape, 60% of frame)
- Outer membrane and inner membrane clearly labeled
- Cristae structure visible with labels
- ATP synthase complexes on inner membrane (labeled "ATP Synthase")
- Electron transport chain components (Complex I-IV) on inner membrane
- Matrix labeled with "TCA Cycle" and Krebs cycle intermediates
- Small arrows showing electron flow and proton gradient
- Legend box (bottom right): color key for different components
Text: All anatomical labels in English, bilingual caption below in Chinese and English
4K resolution, 4:3 aspect ratio
關鍵提示技巧:在描述細胞結構時,使用截面視圖(cross-section view) 更能展示內部結構;加入雙語標註(bilingual caption) 可直接用於中文期刊投稿。
場景四:數據可視化信息圖
適用場景:結果展示、綜述摘要,將複雜數據關係轉化爲直觀視覺圖表。
提示詞模板:
Create a scientific infographic summarizing CRISPR-Cas9 gene editing efficiency data.
Style: Modern scientific infographic, dark background (#1a1a2e), high contrast.
Layout: 2x2 grid of mini-charts:
Top-left: Bar chart "Editing Efficiency by Cell Type" - HEK293/iPSC/T-cell/Primary Neuron
Top-right: Pie chart "Off-target Distribution" - 3 categories with percentages
Bottom-left: Line graph "Efficiency Over Time (Days 1-14)" - two conditions
Bottom-right: Comparison table "sgRNA Design Methods" - 3 methods, 3 metrics
Color scheme: Blue (#3b82f6) for primary data, Green (#10b981) for positive results
All axis labels, titles, and data values visible and correctly spelled
Include figure title at top: "CRISPR-Cas9 Editing Performance Summary"
4K resolution, 16:9 aspect ratio
場景五:雙語學術海報
適用場景:學術會議、研究展示,需要同時呈現中英雙語內容的專業海報。
提示詞模板:
Design a bilingual academic conference poster for a cancer immunotherapy study.
Style: Professional academic poster, dark navy background, white and gold accents.
Layout (top to bottom):
- Title bar: "Targeting PD-L1 in Triple-Negative Breast Cancer" (English)
          "靶向 PD-L1 治療三陰性乳腺癌" (Chinese, below English)
- Author line: "[Author Names] · [Institution] · [Conference Name] 2026"
- 3-column body:
  Left: "Background / 研究背景" - 3 bullet points each language
  Middle: Central mechanism diagram (simplified PD-1/PD-L1 pathway)
  Right: "Results / 研究結果" - 2 key bar charts with bilingual labels
- Bottom: "Conclusion / 結論" banner with key finding
- QR code (bottom right) with caption "Scan for full paper"
Colors: Navy #0f172a background, gold #f59e0b accents, white text
All Chinese and English text must be correctly rendered and readable
4K resolution, 2:3 portrait aspect ratio (A0 poster format)
Nano Banana Pro 科研繪圖 API 快速上手
環境準備
pip install google-generativeai pillow
極簡調用示例(生成一張機制圖)
import google.generativeai as genai
import base64

# 通過 API易 調用,價格 $0.05/張(官網 $0.24)
genai.configure(
    api_key="YOUR_APIYI_KEY",
    client_options={"api_endpoint": "vip.apiyi.com"}
)

model = genai.GenerativeModel("gemini-3-pro-image-preview")

prompt = """
Create a scientific MAPK/ERK signaling pathway diagram.
White background, academic publication style.
Show: EGFR → RAS → RAF → MEK → ERK → ELK1 cascade.
Each protein labeled clearly, arrows show activation/inhibition.
4K resolution, 3:4 aspect ratio, SCI journal quality.
"""

response = model.generate_content(
    prompt,
    generation_config=genai.GenerationConfig(
        response_modalities=["IMAGE"],
        resolution="4K",
        aspect_ratio="3:4"
    )
)

for part in response.candidates[0].content.parts:
    if part.inline_data:
        with open("mapk_pathway.png", "wb") as f:
            f.write(base64.b64decode(part.inline_data.data))
        print("機制圖已生成:mapk_pathway.png")
🚀 快速開始:在 API易 apiyi.com 註冊獲取 API Key,複製上方代碼替換
YOUR_APIYI_KEY即可運行。平臺提供免費測試額度,5 分鐘內即可生成第一張科研圖。
查看完整批量生成代碼(含多場景、自動命名、錯誤重試)
import google.generativeai as genai
import base64
import os
import time
from typing import Optional

# 初始化客戶端 - API易 apiyi.com,$0.05/張
genai.configure(
    api_key="YOUR_APIYI_KEY",
    client_options={"api_endpoint": "vip.apiyi.com"}
)
model = genai.GenerativeModel("gemini-3-pro-image-preview")


def generate_scientific_figure(
    prompt: str,
    output_filename: str,
    resolution: str = "4K",
    aspect_ratio: str = "4:3",
    max_retries: int = 3
) -> Optional[str]:
    """
    生成科研圖表

    Args:
        prompt: 圖表描述(英文效果更佳)
        output_filename: 輸出文件名(.png)
        resolution: 1K / 2K / 4K
        aspect_ratio: 16:9 / 4:3 / 3:4 / 1:1
        max_retries: 失敗重試次數

    Returns:
        成功返回文件路徑,失敗返回 None
    """
    for attempt in range(max_retries):
        try:
            response = model.generate_content(
                prompt,
                generation_config=genai.GenerationConfig(
                    response_modalities=["IMAGE"],
                    resolution=resolution,
                    aspect_ratio=aspect_ratio
                )
            )
            for part in response.candidates[0].content.parts:
                if part.inline_data and part.inline_data.mime_type.startswith("image/"):
                    os.makedirs(os.path.dirname(output_filename) or ".", exist_ok=True)
                    with open(output_filename, "wb") as f:
                        f.write(base64.b64decode(part.inline_data.data))
                    return output_filename
        except Exception as e:
            print(f"  嘗試 {attempt + 1}/{max_retries} 失敗: {e}")
            if attempt < max_retries - 1:
                time.sleep(5)
    return None


# 預定義科研圖表任務列表
FIGURE_TASKS = [
    {
        "name": "MAPK信號通路圖",
        "filename": "figures/fig1_mapk_pathway.png",
        "resolution": "4K",
        "aspect_ratio": "3:4",
        "prompt": """
        Scientific diagram: MAPK/ERK signaling pathway.
        White background, academic style.
        Top to bottom: EGFR receptor → RAS (GTP-bound) → RAF → MEK1/2 → ERK1/2 → nucleus (ELK1, c-Fos).
        Each component: rounded rectangle, bold protein name label.
        Activation arrows: solid black. Phosphorylation: circled 'P' symbol in red.
        Color: blue membrane, green cytoplasm proteins, red nuclear targets.
        Add "MAPK/ERK Signaling Pathway" title at top.
        Publication quality, 4K.
        """
    },
    {
        "name": "RNA-seq實驗流程圖",
        "filename": "figures/fig2_rnaseq_workflow.png",
        "resolution": "4K",
        "aspect_ratio": "16:9",
        "prompt": """
        Scientific workflow diagram: RNA-seq analysis pipeline.
        Dark blue background, white icons and text.
        6 steps left to right with connecting arrows:
        1. Sample Collection (test tube icon)
        2. RNA Extraction (helix icon)
        3. Library Prep (fragment icon)
        4. Sequencing (chip icon)
        5. Bioinformatics (terminal icon)
        6. Visualization (chart icon)
        Steps 1-4 in blue (wet lab), steps 5-6 in purple (computational).
        Each step: icon + step name + time estimate below.
        Title: "RNA-seq Analysis Workflow". 4K, 16:9.
        """
    },
    {
        "name": "線粒體結構圖",
        "filename": "figures/fig3_mitochondria.png",
        "resolution": "4K",
        "aspect_ratio": "4:3",
        "prompt": """
        Scientific cell biology illustration: mitochondrion cross-section.
        White background, textbook illustration style.
        Detailed cross-section showing: outer membrane, inner membrane, cristae,
        matrix with TCA cycle label, ATP synthase complexes (labeled) on inner membrane,
        electron transport chain (Complex I-IV, labeled individually).
        Small curved arrows showing proton gradient and electron flow.
        Legend bottom-right: color key.
        Bilingual labels: English primary, Chinese translation in parentheses.
        Title: "Mitochondrial Structure and Function / 線粒體結構與功能".
        4K, 4:3 ratio.
        """
    },
]


def batch_generate_figures(tasks: list, output_dir: str = "figures") -> dict:
    """批量生成科研圖表"""
    results = {"success": [], "failed": []}
    total = len(tasks)

    print(f"\n開始批量生成 {total} 張科研圖表...")
    print(f"平臺: API易 apiyi.com | 單價: $0.05/張 | 預計總成本: ${total * 0.05:.2f}\n")

    for i, task in enumerate(tasks, 1):
        print(f"[{i}/{total}] 正在生成: {task['name']}")
        path = generate_scientific_figure(
            prompt=task["prompt"],
            output_filename=task.get("filename", f"{output_dir}/figure_{i:02d}.png"),
            resolution=task.get("resolution", "4K"),
            aspect_ratio=task.get("aspect_ratio", "4:3")
        )
        if path:
            results["success"].append({"name": task["name"], "path": path})
            print(f"  ✓ 完成: {path}")
        else:
            results["failed"].append(task["name"])
            print(f"  ✗ 失敗: {task['name']}")
        # 避免觸發速率限制
        if i < total:
            time.sleep(2)

    print(f"\n生成完畢: 成功 {len(results['success'])} 張,失敗 {len(results['failed'])} 張")
    print(f"實際成本: ${len(results['success']) * 0.05:.2f}")
    return results


if __name__ == "__main__":
    results = batch_generate_figures(FIGURE_TASKS)
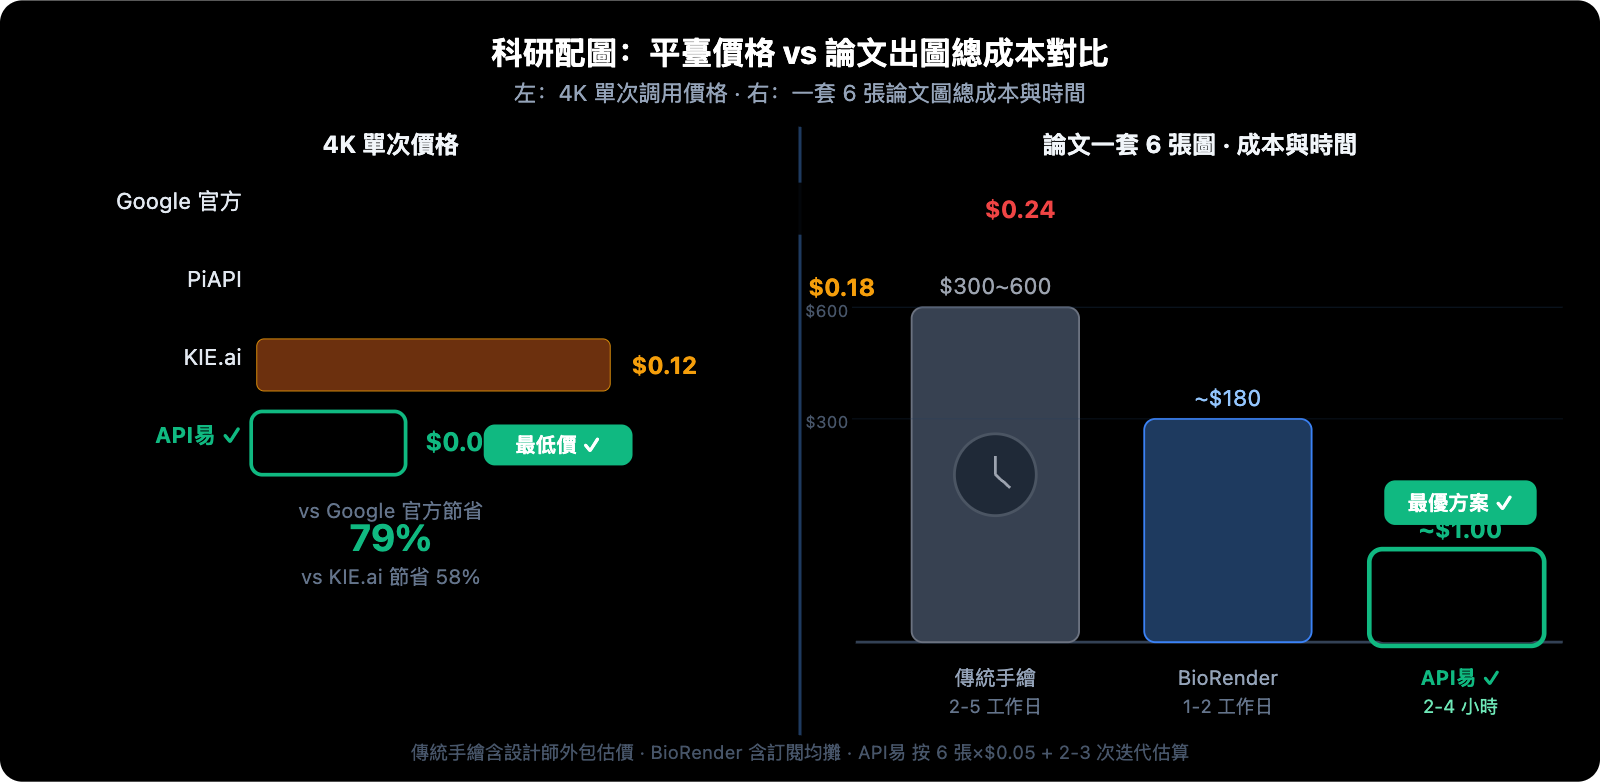
💰 成本對比:生成 20 張科研圖(論文一套完整配圖),Google 官方需 $4.80,通過 API易 apiyi.com 僅需 $1.00,節省 79%。對於需要頻繁迭代修改的科研場景,成本優勢極爲顯著。
科研繪圖提示詞進階技巧
提示詞結構公式
優質科研圖提示詞 = 主題定義 + 風格規格 + 元素清單 + 標註要求 + 分辨率參數
| 要素 | 示例 | 作用 |
|---|---|---|
| 主題定義 | "Scientific diagram of CRISPR-Cas9 mechanism" | 告知模型專業領域 |
| 風格規格 | "White background, academic publication style" | 控制整體視覺風格 |
| 元素清單 | "Show: Cas9 protein, sgRNA, target DNA, PAM sequence" | 確保關鍵內容不遺漏 |
| 標註要求 | "All components labeled in English, bilingual Chinese caption" | 精準控制文字內容 |
| 分辨率參數 | "4K resolution, 16:9 aspect ratio" | 滿足投稿規格 |
常見錯誤與修復
問題 1:文字標註位置錯亂
❌ 錯誤提示: "label the proteins"
✅ 修復提示: "Each protein shown as rectangle with bold label text centered inside,
              all labels: Arial 12pt equivalent, black text on white background"
問題 2:通路方向混亂
❌ 錯誤提示: "show the signaling cascade"
✅ 修復提示: "Top-to-bottom vertical flow: step 1 at top → step 2 → step 3 at bottom,
              directional arrows pointing downward between each component"
問題 3:顏色缺乏區分度
❌ 錯誤提示: "use different colors for each component"
✅ 修復提示: "Color coding: membrane proteins #3b82f6 (blue), cytoplasmic #10b981 (green),
              nuclear #f97316 (orange), inhibitory elements #ef4444 (red)"
不同學科場景的分辨率與寬高比推薦
科研圖表的寬高比直接影響排版效果,以下是按投稿場景整理的推薦參數:
| 使用場景 | 推薦寬高比 | 推薦分辨率 | 說明 |
|---|---|---|---|
| 期刊單欄圖 | 4:3 |
4K | Nature/Science 單列插圖 |
| 期刊雙欄圖 | 16:9 |
4K | 跨欄寬幅複合圖 |
| 豎版機制圖 | 3:4 |
4K | 信號通路、樹狀圖等縱向圖 |
| 學術會議海報 | 2:3 |
4K | A0/A1 尺寸海報(豎版) |
| PPT/幻燈片配圖 | 16:9 |
2K | 演講演示用圖 |
| 方形示意圖 | 1:1 |
2K | 社媒發佈或補充材料 |
| 橫幅流程圖 | 21:9 |
4K | 長流程實驗步驟圖 |
從提示詞到發表:一套論文配圖的完整工作流
以一篇細胞生物學論文爲例,完整配圖流程:
Step 1:規劃圖表結構(無 API 成本)
確定需要的圖表類型和數量:
- Figure 1: 研究模型機制圖(信號通路)→ 3:4 豎版
- Figure 2: 實驗設計流程圖 → 16:9 橫版
- Figure 3A-C: 數據結果多面板圖 → 16:9,2×3 佈局
- Supplementary: 細胞結構示意圖 × 2 → 4:3
共 6 張圖,API易 總成本:$0.30
Step 2:逐張生成並迭代(每次 $0.05)
# 生成 → 檢查 → 修改提示詞 → 再生成
# 典型迭代次數:2-3 次/張,單圖總成本 $0.10-0.15
Step 3:準確性覈查(必須步驟)
對照 KEGG / UniProt / Reactome 數據庫覈查:
- 蛋白質名稱拼寫 ✓
- 通路方向和箭頭含義 ✓
- 相互作用關係正確性 ✓
Step 4:格式處理
4K PNG → 期刊要求 300 DPI TIFF(使用 GIMP 或 Photoshop 轉換)
如需矢量圖:可將 PNG 導入 Adobe Illustrator 進行追蹤
🎯 效率對比:傳統手工繪製一套 6 張論文配圖需 2-5 個工作日,使用 Nano Banana Pro + API易 整套流程約 2-4 小時,成本不到 $1。建議通過 API易 apiyi.com 獲取 API Key 後按本文模板直接套用,大幅壓縮論文準備週期。
平臺價格與 API 對比
| 調用方式 | 4K 單價 | 穩定性 | 格式支持 | 適合場景 |
|---|---|---|---|---|
| Google 官方 | $0.24/次 | ★★★★★ | 原生格式 | 企業大額預算 |
| API易 | $0.05/次 | ★★★★★ | 原生格式 ✅ | 科研批量生成 |
| KIE.ai | $0.12/次 | ★★★☆☆ | 自定義格式 | 偶發使用 |
| PiAPI | $0.18/次 | ★★★★☆ | 自定義格式 | 商業場景 |
🎯 選擇建議:對於科研人員和實驗室來說,論文修改往往需要反覆調整圖表,批量生成需求大。建議通過 API易 apiyi.com 接入,以最低成本完成批量出圖。平臺支持谷歌原生 Gemini 格式,無需格式轉換,直接兼容本文所有代碼示例。
常見問題
Q1:Nano Banana Pro 生成的科研圖可以直接投稿 SCI 期刊嗎?
可以使用,但需注意以下幾點:
- 準確性覈查必須:AI 生成的通路圖可能存在細節錯誤(如異常分支、虛構蛋白互作),投稿前務必與權威數據庫(UniProt、KEGG、Reactome)比對驗證
- 分辨率符合要求:選擇 4K 輸出,大多數期刊要求 300 DPI 以上,4K 圖像充分滿足
- AI 使用聲明:Nature、Science 等頂刊要求在方法部分聲明使用 AI 工具生成插圖
- 矢量圖需求:部分期刊要求提供 SVG/EPS 矢量格式,Nano Banana Pro 輸出爲光柵圖,此類期刊需額外處理
通過 API易 apiyi.com 調用生成的圖像與官方質量完全一致,適合用於預印本、非頂刊投稿及教學材料。
Q2:如何生成多面板複合圖(如 Figure 1A-1F)?
Nano Banana Pro 支持在單張圖像中生成多面板佈局,提示詞需明確指定:
Create a multi-panel scientific figure (2 rows × 3 columns, labeled A-F):
Panel A (top-left): [描述A圖內容]
Panel B (top-center): [描述B圖內容]
Panel C (top-right): [描述C圖內容]
Panel D (bottom-left): [描述D圖內容]
Panel E (bottom-center): [描述E圖內容]
Panel F (bottom-right): [描述F圖內容]
Each panel: white background, bold letter label top-left (A, B, C...),
thin gray border between panels, consistent color scheme.
4K resolution, 16:9 aspect ratio.
如果各子圖內容差異較大,也可分別生成後用 Python PIL 拼合,通過 API易 apiyi.com 批量生成多子圖成本僅 $0.30(6 張×$0.05)。
Q3:中文標註總是出現亂碼或顯示不全,怎麼解決?
Nano Banana Pro 的中文渲染能力優秀,但需要正確的提示詞寫法:
- 明確聲明語言:在提示詞中加入
"Chinese text must be correctly rendered in Simplified Chinese characters" - 指定字體風格:
"Use standard Song/Hei font style for Chinese labels" - 控制文字密度:中文標註不要過多,重要標註保留,次要信息改用圖例
- 雙語策略:英文主標註 + 中文括號補充,如
"Mitochondria (線粒體)",英文主導時中文渲染更穩定
如問題仍存在,可先生成英文版圖,再通過 API易 apiyi.com 發起圖生圖請求,要求"在此圖基礎上將所有英文標註替換爲中文"。
總結
用 Nano Banana Pro 做科研繪圖的核心要點:
- 文字精度是最大優勢:97%+ 多語言準確率,蛋白質名稱、通路標籤精準渲染,優於所有同類工具
- 5 類場景各有專屬提示詞結構:信號通路圖用"縱向級聯流"模板,實驗流程圖用"橫向步驟流",複合圖明確面板佈局
- 價格選 API易:$0.05/張(官網 $0.24),批量生成論文配圖成本降低 79%,支持谷歌原生格式直接調用
- 投稿前務必覈查準確性:AI 圖像可能含有專業細節錯誤,需對照權威數據庫驗證
推薦通過 API易 apiyi.com 搭建科研繪圖自動化工作流,將本文代碼保存爲模板,按需替換提示詞批量生成,顯著提升論文準備效率。
參考資料
-
Google Gemini API 圖像生成文檔
- 鏈接:
ai.google.dev/gemini-api/docs/image-generation - 說明:Nano Banana Pro 官方參數說明,含科學圖像生成最佳實踐
- 鏈接:
-
Google PaperBanana 框架介紹
- 鏈接:
the-decoder.com/googles-paperbanana-uses-five-ai-agents-to-auto-generate-scientific-diagrams - 說明:Google 面向學術插圖自動生成的多智能體框架技術細節
- 鏈接:
-
Nano Banana Pro 生命科學應用評測
- 鏈接:
intuitionlabs.ai/articles/gemini-nano-banana-pro-life-sciences - 說明:針對細胞生物學、分子生物學場景的系統性能測評
- 鏈接:
-
API易平臺接入文檔
- 鏈接:
docs.apiyi.com - 說明:API Key 獲取、Gemini 原生格式接入說明和定價詳情
- 鏈接:
作者:技術團隊
技術交流:歡迎在評論區分享你的科研繪圖作品,更多 AI 繪圖技巧可訪問 API易 apiyi.com 技術社區