

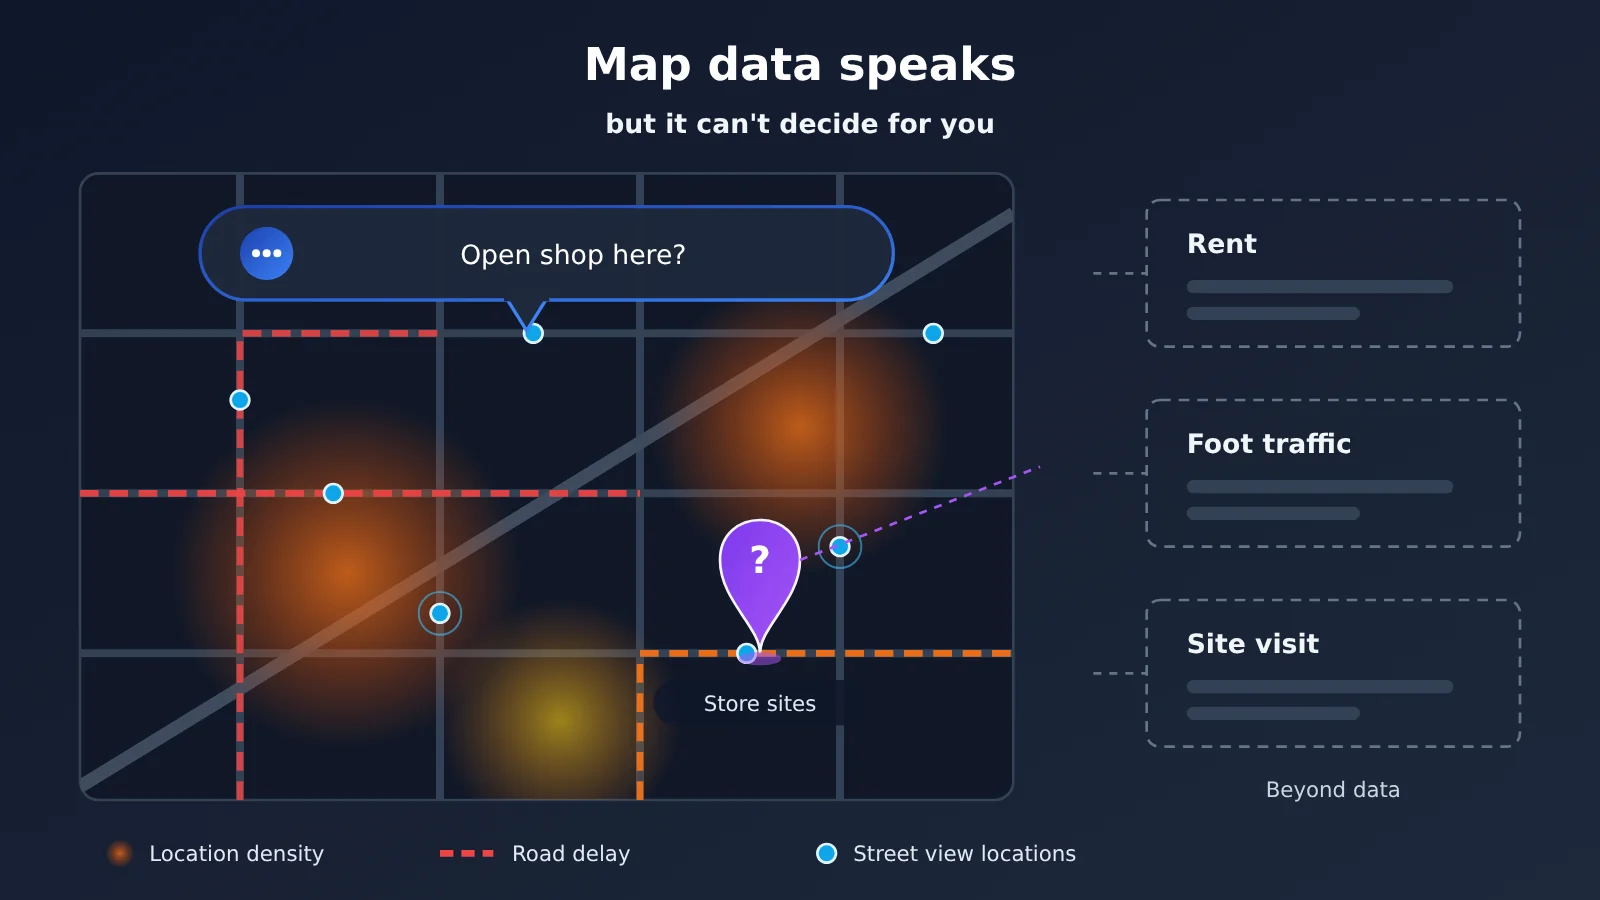
The short answer: Google announced the Geospatial Analytics Playground on November 11, 2026. It lets users query three types of data in BigQuery — places, roads, and street view — in natural language, lowering the barrier to map data analysis. But it still can’t decide your store location for you. Density, traffic, and visual evidence each answer only part of the site-selection question; key inputs like rent, operating costs, and on-the-ground conditions aren’t in this dataset. By its official positioning, it’s mainly meant for companies to assess data coverage and usefulness before formal integration or procurement — not a site-selection tool that hands you an answer.
What you’ll learn from this article
- What the Geospatial Analytics Playground is, and what capabilities were officially announced on 2026-11-11.
- What problems each of the three data types — Places Insights, Roads Management Insights, Street View Insights — solves.
- Key usage conditions from the Places Insights docs, such as aggregate query requirements and access application requirements.
- Why “map data talks” doesn’t mean “map data decides,” and what information is still missing when choosing a site.
- How ordinary users, developers, and corporate site-selection teams should think about this launch.
Index: The lead-in before the main body first uses a table to explain concepts like BigQuery, ADK, and Place ID, then covers how this launch affects different groups. The “Objective facts” section, based on official announcements and documentation, lays out product capabilities, architecture, examples, and usage conditions, and flags what this article hasn’t verified. The “Analysis and judgment” section explains the boundaries of each of the three data types, what’s still missing for site-selection decisions, and what changes are worth watching next.
Google Maps Data Analysis: Concepts You Need to Know
This release touches on map data, cloud data warehouses, and AI agents all at once — and some of these terms aren’t exactly common knowledge. The table below explains only the concepts that are relevant to this article.
| Concept | Brief explanation |
|---|---|
| Geospatial Analytics Playground | An experimental environment from Google Maps Platform for exploring a range of geospatial datasets using natural language |
| BigQuery | Google Cloud’s data warehouse service; all three types of map insight data in this release are queried there |
| Places Insights | Aggregated place data that provides counts and density statistics for various types of places within a given area |
| Roads Management Insights | Road management insight data used to analyze traffic conditions and road reliability |
| Street View Insights | Street View insight data, used for visual-level analysis based on Street View imagery |
| ADK | Google’s Agent Development Kit; this architecture uses it to build agents |
| Domain agent | An agent dedicated to a specific type of data or task — for example, one that only handles place data or road data |
| Modular skill | Breaking specific capabilities into composable modules that agents can call on demand |
| Place ID | The unique identifier for each place in Google Maps, which can be used to chain other Maps APIs and pull details for a single place |
| Aggregated data | Summary results computed by dimensions such as region and category, not record-by-record raw data |
Google Maps Data Starts Talking: Impact at a Glance
The direct audience for this release is enterprises and developers; the impact on ordinary users is very indirect. The table below lists only impacts that make a substantive difference and have supporting evidence.
| Audience | Impact |
|---|---|
| Enterprise site selection / business analytics teams | Before purchasing, you can try querying the data in natural language to judge coverage and suitability, but you can’t use it as a substitute for full site-selection due diligence |
| Developers / data engineers | You can borrow the architectural idea of combining multiple data sources via ADK, domain agents, and modular skill composition; official access to Places Insights still requires an access request |
| City operations and infrastructure teams | Road reliability analysis and Street View visual inspection (e.g., tilted utility poles) now have a lower-barrier way to explore |
| Ordinary map users | No direct change in the short term — this is a product aimed at enterprise data analytics |
Google Maps Data Analytics Playground: The Objective Facts
This section is based on two official sources: first, the Google Maps Platform official blog post from 2026-11-11 (mapsplatform.google.com/resources/blog/meet-the-geospatial-analytics-playground-explore-maps-insights-with-ai/), and second, the official Places Insights documentation (developers.google.com/maps/documentation/placesinsights/overview). The verification date for this article is 2026-11-17.
What Google Launched: Geospatial Analytics Playground
On November 11, 2026, Google Maps Platform announced the Geospatial Analytics Playground. The key change here is that users no longer need to write queries first — they can ask questions in natural language and connect to three types of map insight datasets in BigQuery.
Google is pretty clear about what it’s for: helping businesses evaluate the coverage and value of these datasets before committing to a full integration or purchase. In other words, it’s more of a test-drive track — a way to answer “is this data actually useful for my business?” — rather than a decision-making system for production environments.
What Each of the Three Google Maps Datasets Does
The three datasets wired into the Playground have distinct roles, each handling a different kind of question.
| Dataset | Primary use | Typical questions it answers | Official example |
|---|---|---|---|
| Places Insights | Location aggregation | How many businesses of a given type are in an area, and how dense is the distribution? | Coffee shop clusters in London |
| Roads Management Insights | Traffic and road reliability | Which road segments tend to be delayed, and at what times? | Morning and evening rush delays in Boston |
| Street View Insights | Street View image analysis | What’s the condition of infrastructure or objects along a street? | Leaning utility pole inspection |
One thing worth emphasizing: the examples in the table are all demo scenarios from the official announcement. I haven’t tested them myself, and they don’t necessarily mean the same results apply in other cities.
The Playground agent architecture: ADK + domain agents + Gemini
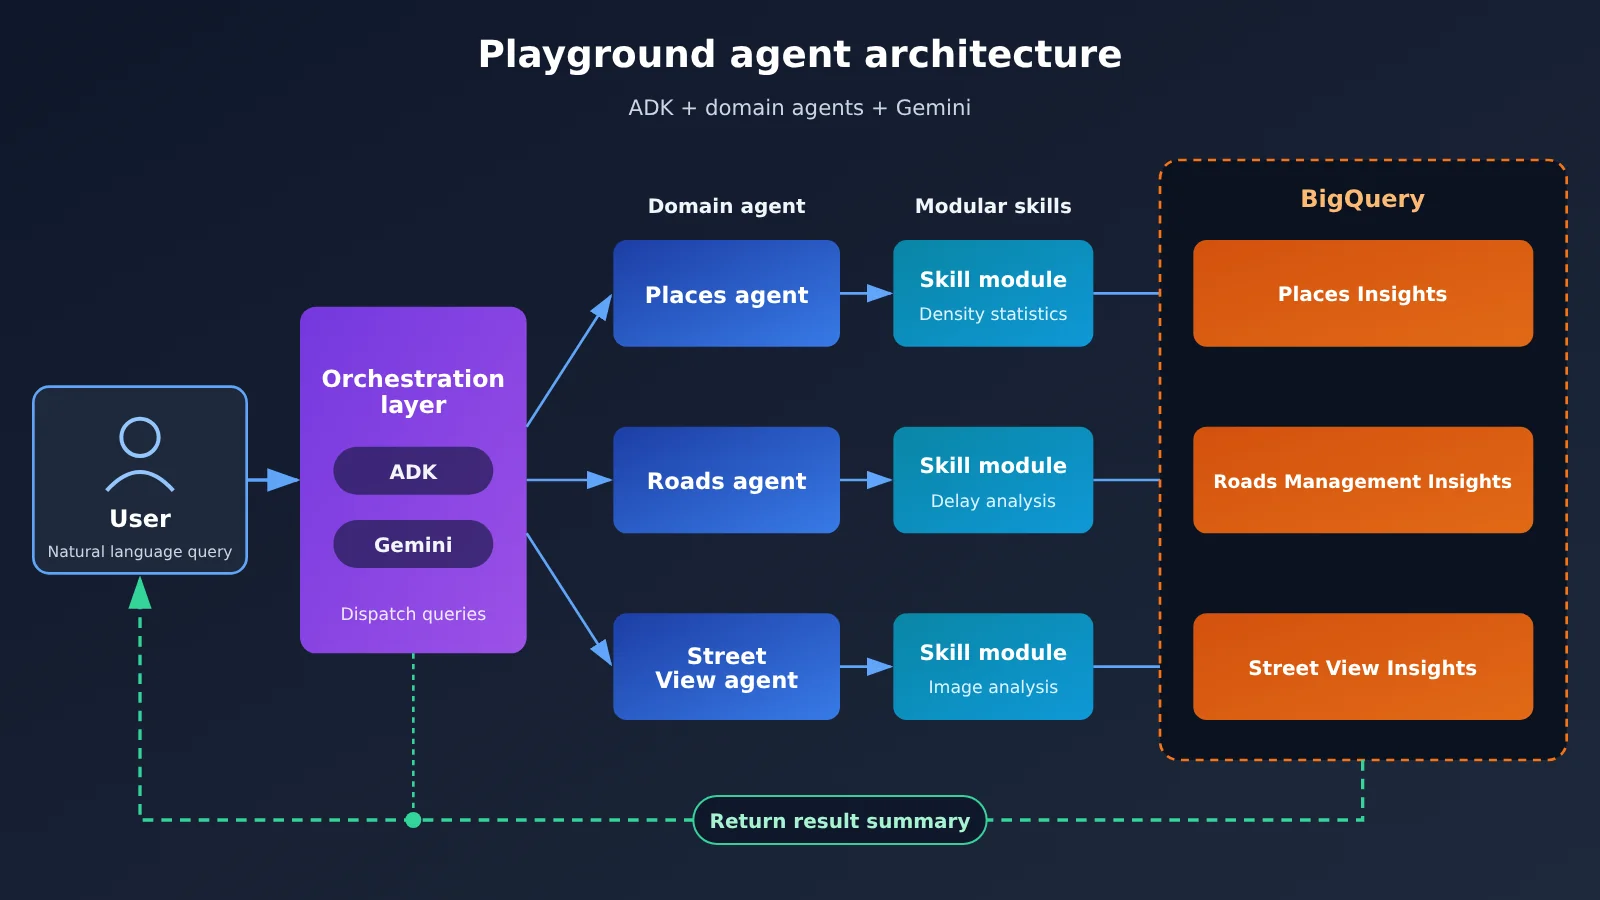
According to the official docs, this system is built with ADK and consists of domain agents plus modular skills, with Gemini as the underlying model. You can think of it this way: each dataset type is handled by an agent that knows that domain, and the specific query and analysis capabilities are broken out into reusable skill modules.
The upside of this split is that when a user asks a question spanning multiple datasets, the system can dispatch it to different domain agents and then aggregate the results. It also makes one thing clear: natural language is just the entry point — what actually answers the question is still those structured or processed datasets inside BigQuery.
Key conditions in the official Places Insights docs
Places Insights is the most directly relevant of the three datasets when it comes to site selection. The official documentation lays out a few key points:
- Aggregates, not individual records: it provides count and density aggregations of places, not a complete list of every individual store.
- Filterable dimensions: you can query by category, rating, opening hours, and other conditions.
- Single-place details go through other APIs: when you need details on a specific place, you use the Place ID to link to other Maps APIs.
- Access must be requested: before you run actual queries against the data, you need to apply for access permission.
That last point matters. Playground lets you try things out first, but going from experimentation to real production use still involves an access request and an integration process.
What We Haven’t Verified
The following points weren’t verified in this article, so we won’t make any judgments about them: whether the Playground and its related datasets are available in mainland China; how well the data covers different regions around the world; and the specific costs of the Playground and the data queries behind it. Please don’t read this launch as “free and available worldwide.” If you have real business needs, rely on Google’s latest official documentation and direct business discussions.
Why Google Maps Data Still Can’t Decide Your Store Location for You: Analysis and Judgment
What follows is analysis and judgment based on the facts above—not an official view.
Three types of map data answer three different questions
Site selection is a comprehensive judgment call, and each of the three data types integrated here only covers one slice of it. Places Insights tells you what’s nearby and how dense it is; Roads Management Insights tells you whether the roads flow smoothly; Street View Insights tells you what the street actually looks like.
The catch is that none of these three answers can be directly converted into “can I make money opening a store here.” A cluster of coffee shops might mean demand is strong — or it might mean the market is already saturated. Heavy peak-hour delays might mean lots of passing traffic, or it might mean customers aren’t willing to stick around. Data can put facts on the table, but how you read them depends on your business type and operating model.
| Questions site selection needs to answer | Evidence Playground data can provide | Limitations of that evidence |
|---|---|---|
| What’s the nearby competition and supporting infrastructure like? | Number of locations, density, category, ratings | Aggregated statistics; can’t see individual store performance |
| How’s transportation accessibility? | Road segment delays, road reliability | Vehicle traffic data doesn’t equal walk-in foot traffic |
| What’s the street environment like? | Street view image analysis results | Images have capture timestamps; may not reflect current conditions |
| Rent and storefront conditions | None | Requires commercial real estate channels |
| Profitability | None | Requires your own operational data and financial models |
| On-site experience and hidden issues | None | Must be assessed in person |
The Three Key Pieces of Information Missing from Site Selection Decisions
As you can see from the table above, at least three types of information aren’t in this dataset.
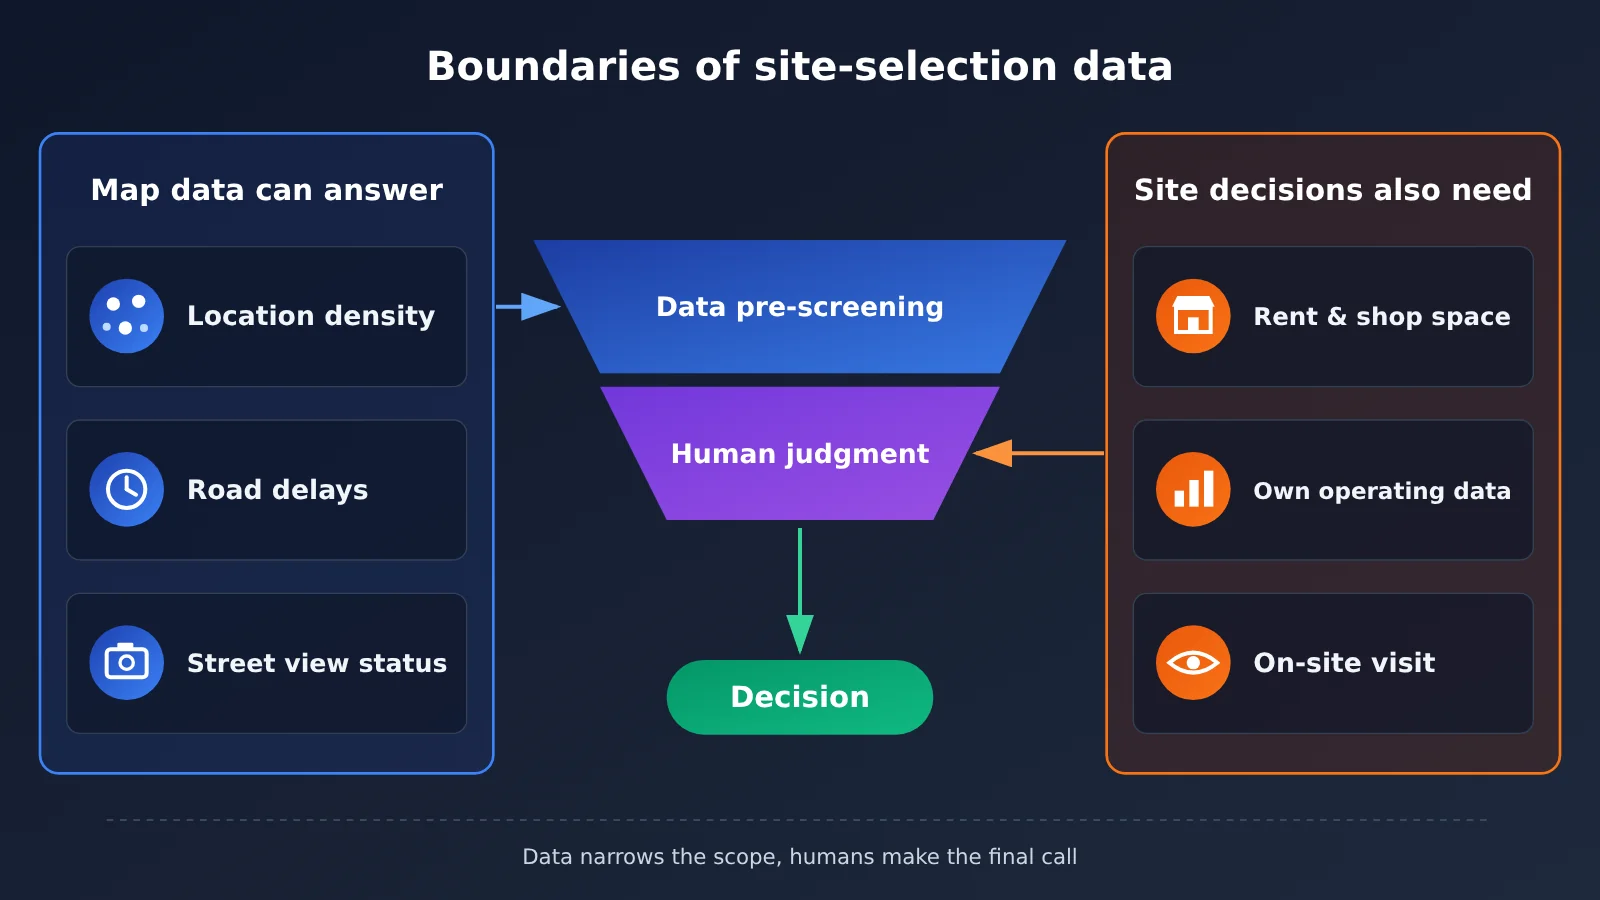
The first is rent and storefront data — rent levels, lease terms, retail space, and transfer status. This directly determines your cost structure, and map insight data doesn’t touch it. The second is operating data, meaning your own store’s historical revenue, average ticket size, and target customer profile. In the same trade area, a bubble tea shop and a community clinic might reach completely opposite conclusions. The third is on-the-ground data, like whether there’s parking out front, how foot traffic differs between day and night, construction plans, and what kinds of businesses are next door. You often only find these out by standing on the street corner watching for a few hours.
So the more sensible approach is to treat Playground as a “triage and question-asking tool”: use the data to narrow down candidate areas first, then make your final call based on rent, operating data, and in-person inspection.
Aggregated Data and Natural Language Interfaces Each Have Hidden Risks
Places Insights provides aggregated data. That’s a plus for privacy and large-scale analysis, but for site selection it means there’s a hard cap on granularity. You can find out how many restaurants are in an area, but the aggregated results won’t tell you which ones are losing money or which ones just closed down.
Natural language interfaces lower the barrier to entry, but they also introduce a new problem: how you phrase a question affects the answer. How do you draw the boundaries of a “coffee shop cluster”? Which time window counts as “peak”? If those definitions aren’t clarified, the numbers you get may not line up with the question you actually care about. For corporate teams, it’s best to have someone who understands data sanity-check the methodology before taking key conclusions into a meeting.
How Different Audiences Should Respond
| Role | Recommended Approach | Pitfalls to Watch For |
|---|---|---|
| Chain brand expansion teams | Use the Playground to assess data coverage in target cities, then decide whether to apply for official access | Assuming that results from the official sample cities will carry over directly to your own market |
| Data analytics / development teams | Look at how the ADK plus domain agents are split up, and evaluate whether they can be combined with your own data | Overlooking real-world constraints like access applications, regional coverage, and cost |
| Small and medium-sized businesses | Simply understanding the thinking behind these tools is enough; for site selection, keep relying primarily on on-the-ground visits and rent calculations | Believing that “the AI has looked at the map” means you can skip the field research step |
Future Developments Worth Watching (Predictive Assessment)
The following is speculation, not something that’s been confirmed. If Google later opens things up so that businesses can join their own data — store revenue, membership distribution, and so on — with these three data types in the same environment for combined queries, Playground’s value for site selection would go up noticeably, because that fills in exactly the missing piece: operational data.
Another thing worth watching is how the data’s regional coverage expands and what the official pricing ends up being. For teams in mainland China, availability alone is the first hurdle — you’ll need to wait for clear information from the official side.
The significance of this release is that it turns map data from “an expert asset that requires writing queries” into “analysis material you can just talk to.” But no matter how rich the material gets, it’s still only one input to a decision. A heatmap on your screen can tell you where things are busy, but it can’t tell you what the entrance to that storefront looks like on a rainy day.
As Lu You wrote in “Reading on a Winter Night, to My Son Ziyu”: “What you get from paper always feels shallow; to truly know a thing, you must practice it yourself.”