Create 7 Types of Scientific Research Statistical Charts with Nano Banana Pro: Code Generation Method Completely Eliminates Numerical Hallucinations
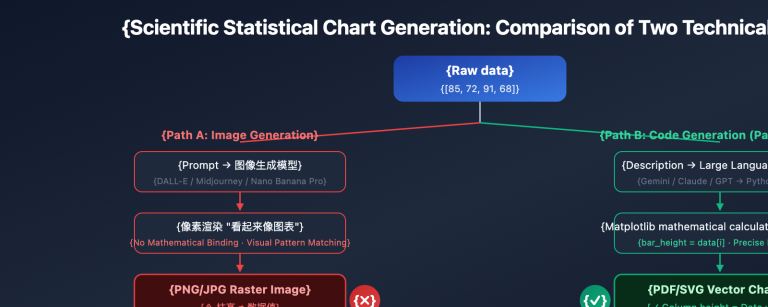
Author's Note: A deep dive into how PaperBanana creates scientific statistical charts by generating executable Matplotlib code instead of pixel images, completely eliminating numerical hallucination issues across 7 chart types, including bar charts, line graphs, and scatter plots. Statistical charts in scientific papers carry the core conclusions of your experiments—the height of a bar, the…