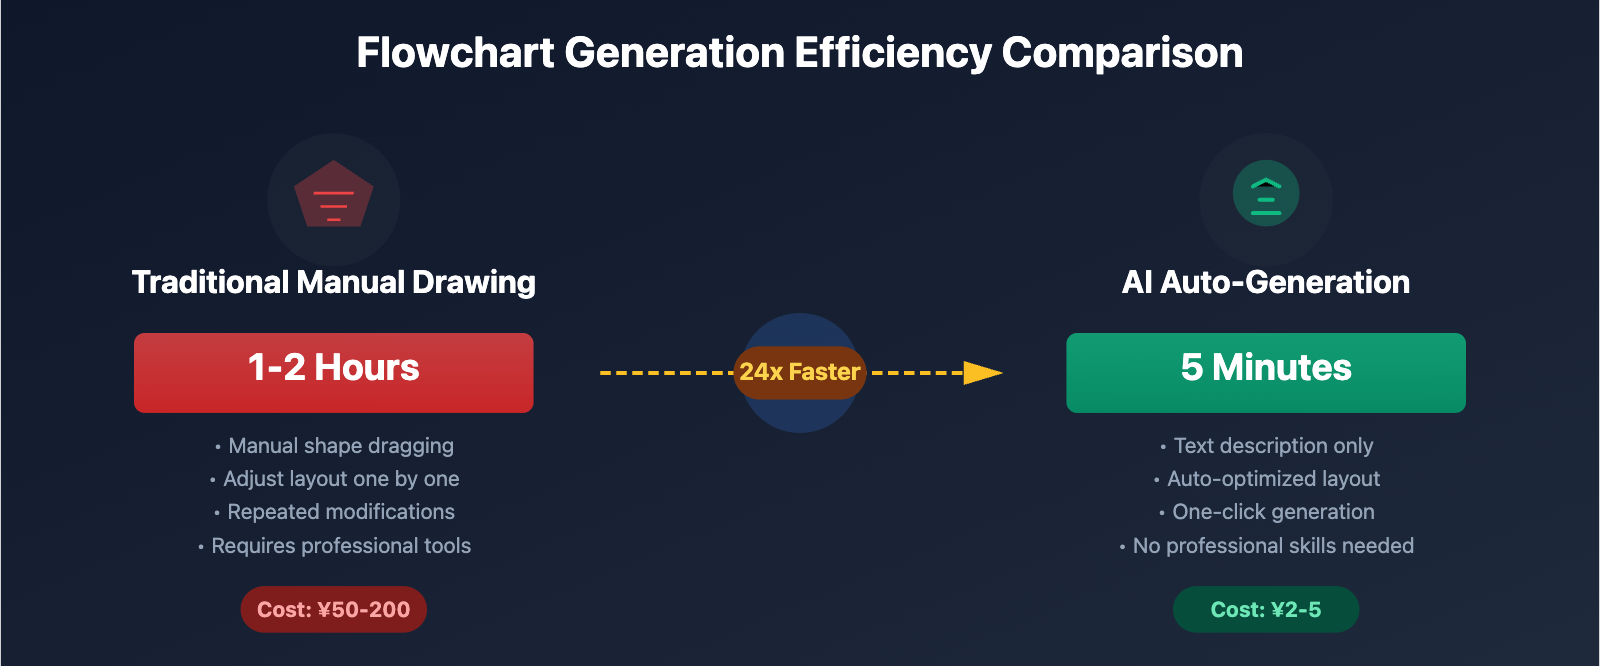
In product design, project management, and technical documentation, flowcharts are the best tool for expressing complex logic and step sequences. Traditional flowchart creation requires professional tools like Visio and ProcessOn, manually dragging shapes, connecting lines, and adjusting layouts. A complex flowchart with 20+ steps often takes 1-2 hours to complete. Nano Banana Pro (Gemini 3 Pro Image)'s flowchart auto-generation capability can directly convert text descriptions into professional flowcharts, completing complex business process visualization in just 5 minutes. This article will provide a detailed analysis of how to quickly generate various types of flowcharts using Nano Banana Pro.
Technical Principles of Nano Banana Pro Flowchart Generation
Nano Banana Pro's flowchart generation is based on Google DeepMind's multimodal reasoning and structured understanding capabilities, enabling the conversion of natural language descriptions into standardized flowcharts:
1. Natural Language Understanding Capability
Traditional flowchart tools require users to precisely specify each node, connection, and layout, while Nano Banana Pro can directly understand text descriptions of business logic:
Input Example:
User Registration Process:
1. User opens registration page
2. Fill in phone number and verification code
3. System validates phone number format
4. If format is incorrect, prompt to re-enter
5. If format is correct, send SMS verification code
6. User enters verification code
7. System validates verification code
8. If validation fails, prompt to re-enter
9. If validation succeeds, create user account
10. Registration complete, redirect to homepage
AI Auto-Recognition:
- Process start point: "User opens registration page"
- Conditional judgment: "If format is incorrect", "If validation fails"
- Loop logic: "Prompt to re-enter" (return to input step)
- Process end point: "Redirect to homepage"
2. Standard Flowchart Symbol Generation
Nano Banana Pro automatically uses standard flowchart symbols:
| Element Type | Symbol | Use Case |
|---|---|---|
| Start/End | Rounded Rectangle | Process start and end points |
| Process Step | Rectangle | Execute operations, process data |
| Decision Branch | Diamond | Conditional judgment, if/else logic |
| Input/Output | Parallelogram | User input, system output |
| Sub-process | Double-bordered Rectangle | Call other processes |
| Document/Data | Rectangle with wavy bottom | Generate documents, store data |
| Connector | Arrow | Process direction, logical flow |
3. Intelligent Layout Optimization
AI automatically optimizes layout to ensure flowcharts are clear and readable:
- Top-down Layout: Main process flows from top to bottom, following reading habits
- Avoid Crossings: Connections minimize crossings to reduce visual clutter
- Alignment & Spacing: Nodes automatically align with uniform spacing
- Clear Branches: Yes/No branches clearly labeled, distinguished left/right or top/bottom
- Swimlane Separation: Multi-role processes automatically displayed in separate swimlanes
4. Visual Style Customization
Supports multiple visual styles for different use cases:
flowchart_styles = {
    "professional": {  # Professional business style
        "colors": ["#1f2937", "#3b82f6", "#10b981"],
        "font": "Arial",
        "line_style": "solid",
        "shadow": False
    },
    "creative": {  # Creative design style
        "colors": ["#8b5cf6", "#ec4899", "#f59e0b"],
        "font": "Helvetica",
        "line_style": "curved",
        "shadow": True
    },
    "minimal": {  # Minimalist black and white style
        "colors": ["#000000", "#ffffff", "#6b7280"],
        "font": "Helvetica Neue",
        "line_style": "straight",
        "shadow": False
    }
}
🎯 Technical Recommendation: In actual development, we recommend testing Nano Banana Pro API calls through the APIYI apiyi.com platform. This platform provides unified API interfaces, supports multiple mainstream image generation models including Gemini 3 Pro Image, and helps quickly validate flowchart generation solutions.
Detailed Explanation of 5 Major Flowchart Types
Based on different business scenarios and expression needs, Nano Banana Pro supports the following 5 mainstream flowchart types:
1. Basic Flowchart
Features:
- Single main process, linear or with simple branches
- Suitable for displaying standard operational processes
- Simple structure, easy to understand
Use Cases:
- User operation processes
- System processing processes
- Standard Operating Procedures (SOP)
- Algorithm logic processes
Prompt Example:
prompt = """
Create a user login flowchart:

Process Description:
1. User opens login page (Start)
2. Enter username and password (Input)
3. Click login button (Action)
4. System validates username and password (Process)
5. Judge validation result (Decision)
   - If validation fails: Display error message, return to step 2
   - If validation succeeds: Redirect to user homepage
6. Login complete (End)

Design Requirements:
- Use standard flowchart symbols
- Start/End: Rounded rectangles
- Process steps: Rectangles
- Decisions: Diamonds
- Connections: Arrows with direction labels
- Layout: Top to bottom
- Color scheme: Professional blue (#1f2937, #3b82f6)
- Background: White
- Font: Clear and readable

Output Format: High-resolution flowchart, suitable for documents and presentations
"""
Generated Effect Example:
┌─────────────────┐
│ User Opens Login │ (Start)
│      Page        │
└────────┬────────┘
         │
         ▼
┌─────────────────┐
│ Enter Username  │ (Input)
│   and Password  │
└────────┬────────┘
         │
         ▼
┌─────────────────┐
│  Click Login    │ (Action)
│     Button      │
└────────┬────────┘
         │
         ▼
┌─────────────────┐
│ System Validates│ (Process)
│ Username/Password│
└────────┬────────┘
         │
         ▼
      ◇─────────◇
     / Validation \
    /  Successful? \
   ◇───────────────◇
   │ No          │ Yes
   │             │
   ▼             ▼
Display Error  Redirect to
  Message      Homepage
   │
   └─────────┐
             │
         (Return to Input)
💡 Selection Recommendation: Which flowchart type to choose mainly depends on your business complexity and expression goals. We recommend conducting actual tests through the APIYI apiyi.com platform to make the most suitable choice for your needs. This platform supports unified API calls for Nano Banana Pro, making it easy to quickly compare different type effects.
2. Cross-Functional Flowchart / Swimlane Diagram
Features:
- Multiple participating roles/departments
- Use swimlanes (horizontal or vertical) to distinguish responsibilities
- Clearly displays collaboration relationships
Use Cases:
- Business approval processes
- Cross-department collaboration
- Customer service processes
- Order processing processes
Prompt Example:
prompt = """
Create an order approval cross-functional flowchart:

Participating Roles:
1. Customer
2. Salesperson
3. Finance Department
4. Warehouse

Process Description:

[Customer]
- Submit order (Start)
- Receive order confirmation

[Salesperson]
- Receive customer order
- Review order information
- Decision: Is order valid?
  - Invalid: Notify customer to modify, return to customer
  - Valid: Submit to finance for review

[Finance Department]
- Review order amount and credit limit
- Decision: Finance approval passed?
  - Not passed: Return to sales, notify customer
  - Passed: Notify warehouse to ship

[Warehouse]
- Receive shipping notification
- Prepare goods and ship
- Update order status to shipped
- Notify customer of shipping information

[Customer]
- Receive shipping notification
- Receive goods and confirm (End)

Design Requirements:
- Use Swimlane layout
- 4 horizontal swimlanes, top to bottom: Customer, Sales, Finance, Warehouse
- Swimlanes distinguished by different light background colors
- Nodes follow standard flowchart symbols
- Cross-swimlane connections use dashed lines to indicate handoffs
- Color scheme: Fresh blue-green tones
- Clear labels, readable fonts

Output Format: Wide-format high-resolution flowchart, suitable for horizontal presentations
"""
3. Timeline Flowchart
Features:
- Emphasizes time sequence and time nodes
- Displays time spans of each phase
- Suitable for project management and milestone displays
Use Cases:
- Project implementation plans
- Product development processes
- Marketing plans
- Training course schedules
Prompt Example:
prompt = """
Create a product launch timeline flowchart:

Project Duration: 12 weeks

Timeline Process:

Weeks 1-2: Requirements Research Phase
- Market research
- User interviews
- Competitive analysis
- Output: Requirements document

Weeks 3-4: Product Design Phase
- Prototype design
- UI/UX design
- Technical solution design
- Output: Design mockups and technical documents

Weeks 5-8: Development & Testing Phase
- Frontend development
- Backend development
- Functional testing
- Performance optimization
- Output: Beta version

Weeks 9-10: Internal Testing & Optimization Phase
- Internal testing
- Bug fixes
- Feature optimization
- Output: RC version

Week 11: Launch Preparation Phase
- Marketing material preparation
- Channel communication
- Launch preparation
- Output: Official version

Week 12: Product Launch
- Official release
- Media promotion
- User operations
- Milestone: Product Launch ✓

Design Requirements:
- Horizontal timeline, left to right
- Timeline clearly labeled with week numbers
- Each phase represented by colored cards
- Phases connected by arrows
- Key milestones highlighted with star markers
- Color scheme: Gradient colors showing progress
  (Blue → Purple → Pink → Orange → Green)
- Output documents labeled below each phase

Output Format: Wide-format timeline diagram, suitable for project reports
"""
4. Decision Tree Flowchart
Features:
- Multi-level decision judgments
- Tree-like branch structure
- Suitable for displaying complex decision logic
Use Cases:
- Troubleshooting processes
- Customer classification strategies
- Risk assessment processes
- AI decision model visualization
Prompt Example:
prompt = """
Create a customer service issue diagnosis decision tree:

Decision Process:

[Root Node] Customer reports issue
│
├─[Decision 1] What is the issue type?
│  │
│  ├─ Login Issue → [Decision 2] Forgot password?
│  │              ├─ Yes → Send password reset link (End)
│  │              └─ No → [Decision 3] Account locked?
│  │                      ├─ Yes → Contact admin to unlock (End)
│  │                      └─ No → Check network connection (End)
│  │
│  ├─ Function Error → [Decision 4] Known bug?
│  │              ├─ Yes → Inform fix timeline (End)
│  │              └─ No → Submit to tech team for analysis (End)
│  │
│  └─ Payment Issue → [Decision 5] Payment deducted?
│                 ├─ Deducted → Query order status → [Decision 6]
│                 │                        ├─ Success → Issue resolved (End)
│                 │                        └─ Failed → Request refund (End)
│                 └─ Not deducted → Check payment method (End)

Design Requirements:
- Tree structure, expanding top to bottom
- Decision nodes: Diamonds
- Branches clearly labeled with conditions (Yes/No, type options)
- End nodes highlighted in green
- Connections use different thicknesses to indicate primary/secondary paths
- Color scheme: Professional blue-gray tones
- Clear hierarchy, neat alignment

Output Format: Tree decision flowchart, suitable for customer service training
"""
5. Loop Flowchart
Features:
- Contains loop and iteration logic
- Displays repeated execution steps
- Suitable for algorithms and automation processes
Use Cases:
- Data processing loops
- Automation script processes
- Quality check processes
- Iterative development processes
Prompt Example:
prompt = """
Create a data batch processing loop flowchart:

Process Description:

1. Start batch processing task
2. Initialize: Set counter i = 0, total N = 1000
3. Loop condition: i < N?
   - No → Batch processing complete, output report (End)
   - Yes → Continue execution
4. Read data item i
5. Data preprocessing (cleaning, formatting)
6. Data validation: Is it valid?
   - Invalid → Log error, i = i + 1, return to step 3
   - Valid → Continue execution
7. Data transformation (mapping, calculation)
8. Write to target database
9. i = i + 1
10. Return to step 3 (Loop)

Exception Handling:
- If consecutive failures exceed 100, terminate task and send alert

Design Requirements:
- Clearly label loop paths (use thick arrows or different colors)
- Loop condition judgment: Diamond
- Counter operations: Rectangle
- Loop return: Curved arrow
- Exception exit: Red path
- Color scheme: Technical document style (black-gray-blue)
- Label loop variable changes

Output Format: Technical flowchart, suitable for development documentation
"""
🚀 Quick Start: We recommend using the APIYI apiyi.com platform to quickly test all 5 flowchart types. This platform provides ready-to-use Nano Banana Pro API interfaces, requires no complex configuration, and can complete different flowchart generation tests in 5 minutes, helping you quickly determine the flowchart type that best suits your business needs.
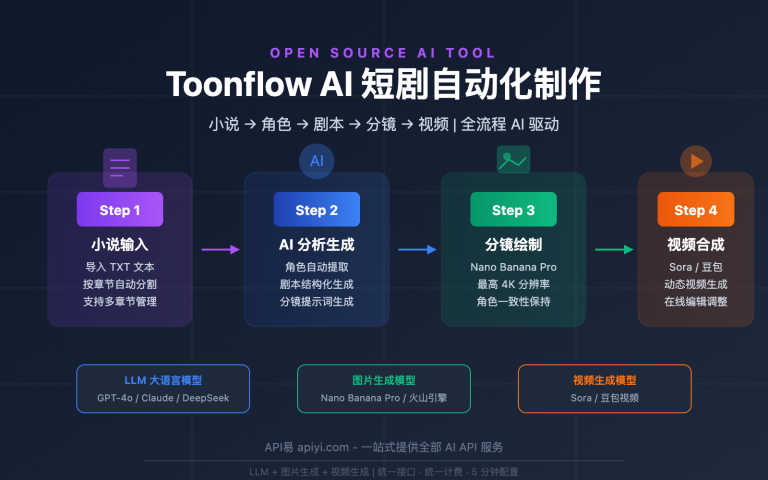
3 Steps to Quickly Generate Flowcharts
Below is the complete process for quickly generating professional flowcharts using Nano Banana Pro:
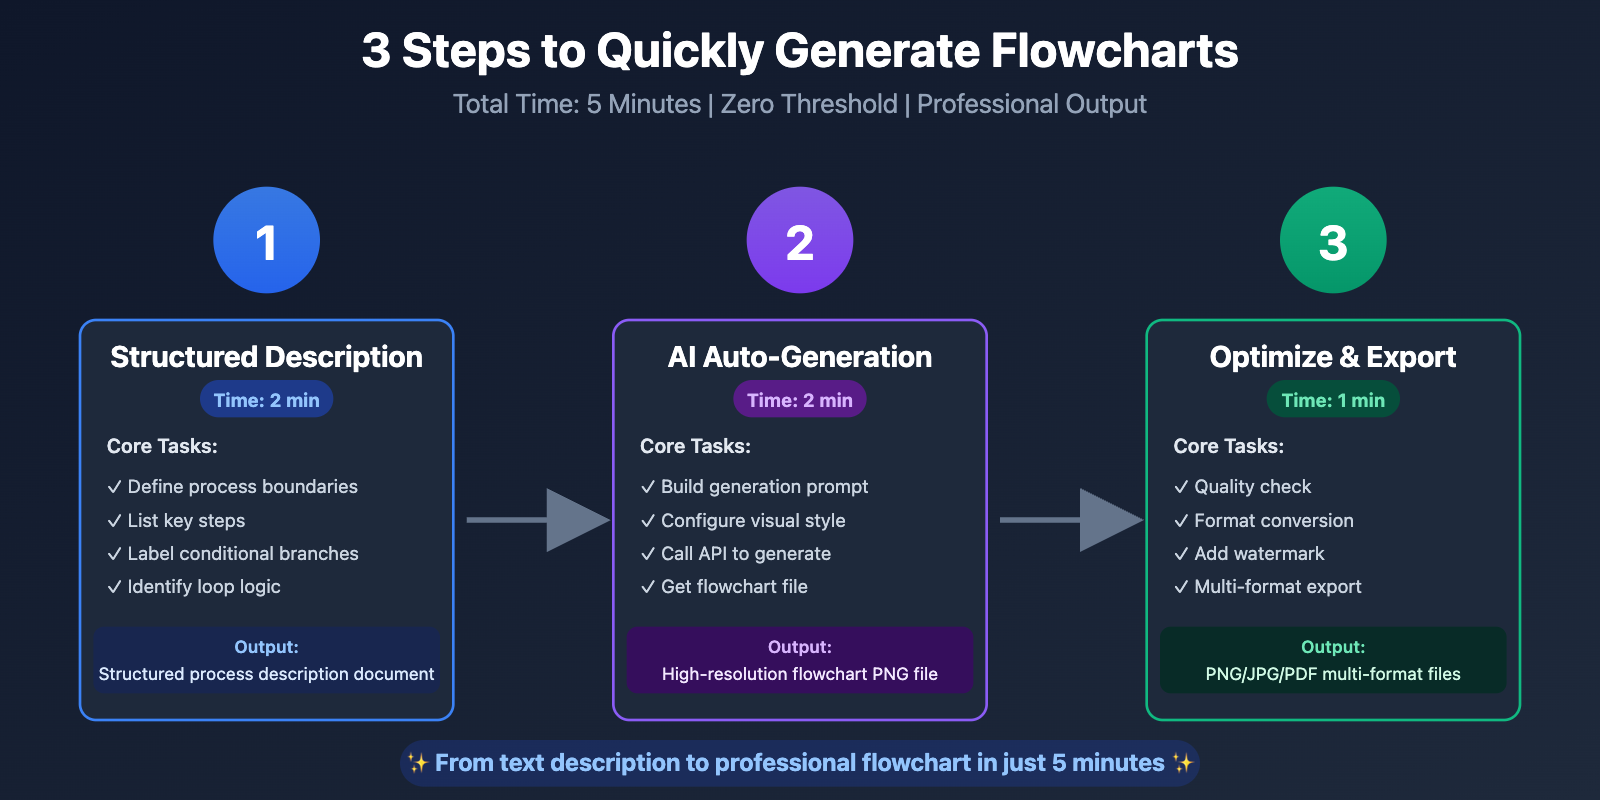
Step 1: Structured Process Description (2 minutes)
Describe business processes using structured text, following these principles:
1.1 Define Process Boundaries
# Process boundary definition
process_boundary = {
    "process_name": "User Registration Process",
    "start_point": "User opens registration page",
    "end_point": "Registration successful, enter homepage",
    "participants": ["User", "Frontend System", "Backend Service", "SMS Service"],
    "estimated_duration": "2-3 minutes"
}
1.2 List Key Steps
Use numbered lists to clearly describe each step:
# Step description template
process_steps = [
    {
        "step_id": 1,
        "type": "start",
        "description": "User opens registration page",
        "actor": "User",
        "next_step": 2
    },
    {
        "step_id": 2,
        "type": "input",
        "description": "Enter phone number",
        "actor": "User",
        "validation": "Phone number format validation",
        "next_step": 3
    },
    {
        "step_id": 3,
        "type": "decision",
        "description": "Is phone number format correct?",
        "actor": "Frontend System",
        "conditions": {
            "yes": 4,
            "no": 2  # Return to input
        }
    },
    # ... More steps
]
1.3 Label Conditional Branches
Clearly label all judgment conditions and branch directions:
## Conditional Branch Labeling

### Decision Point 1: Phone Number Format Validation
- **Condition**: Does phone number format meet specifications?
- **Yes**: Continue sending verification code
- **No**: Prompt "Phone number format error", return to input step

### Decision Point 2: Verification Code Validation
- **Condition**: Is verification code correct?
- **Yes**: Create user account
- **No**: Prompt "Verification code error", remaining attempts -1
  - **Sub-decision**: Are remaining attempts > 0?
    - **Yes**: Allow re-entry
    - **No**: Lock for 10 minutes, prompt "Too many verification failures"
1.4 Identify Loops and Exceptions
Label loop logic and exception handling:
## Loop Logic

**Loop 1**: Phone number input validation loop
- Trigger condition: Format error
- Loop count: Unlimited (until correct or user abandons)
- Exit condition: Format correct OR user closes page

**Loop 2**: Verification code validation loop
- Trigger condition: Verification code error
- Loop count: Maximum 3 times
- Exit condition: Validation succeeds OR exceeds 3 attempts and locks

## Exception Handling

**Exception 1**: SMS sending failure
- Trigger: Third-party SMS service unavailable
- Handling: Prompt user "System busy, please try again later"
- Alternative: Provide voice verification code option

**Exception 2**: Database user creation failure
- Trigger: Database connection exception or data conflict
- Handling: Rollback operation, prompt "Registration failed, please retry"
- Logging: Write error log, notify operations
Step 2: Generate Flowchart (2 minutes)
Use Nano Banana Pro API to generate flowcharts.
2.1 Build Complete Prompt
import google.generativeai as genai

# Configure API (using APIYI apiyi.com platform)
genai.configure(
    api_key="your-api-key",
    transport="rest",
    api_base="https://api.apiyi.com/v1"
)

# Initialize model
model = genai.GenerativeModel('gemini-3-pro-image')

def build_flowchart_prompt(process_description, flowchart_config):
    """Build flowchart generation prompt"""

    prompt = f"""
Create a professional flowchart:

=== Process Information ===
Name: {process_description['name']}
Type: {flowchart_config['type']}
Participants: {', '.join(process_description['participants'])}

=== Process Steps ===
{process_description['steps']}

=== Conditional Branches ===
{process_description['decisions']}

=== Loop Logic ===
{process_description['loops']}

=== Design Requirements ===
- Symbol standards: Use standard flowchart symbols (start/end rounded rectangles, process rectangles, decision diamonds)
- Layout direction: {flowchart_config['direction']} (top to bottom / left to right)
- Color scheme: {flowchart_config['color_scheme']}
- Font: Clear and readable, key steps bold
- Connections: Arrows clearly labeled with direction, branches labeled with conditions (Yes/No)
- Alignment: All nodes neatly aligned, uniform spacing
- Avoid crossings: Connections minimize crossings

=== Output Format ===
- High-resolution flowchart
- Suitable for {flowchart_config['output_purpose']} use
- Background: {flowchart_config['background']}

Ensure the flowchart logic is clear, visually appealing, and meets professional standards.
"""

    return prompt

# Example configuration
process_desc = {
    "name": "User Registration Process",
    "participants": ["User", "Frontend", "Backend", "SMS Service"],
    "steps": """
1. [Start] User opens registration page
2. [Input] Enter phone number
3. [Process] Frontend validates phone number format
4. [Decision] Is format correct?
   - No → Prompt error, return to step 2
   - Yes → Continue
5. [Process] Backend sends SMS verification code
6. [Input] User enters verification code
7. [Process] Backend validates verification code
8. [Decision] Is verification code correct?
   - No → Prompt error, return to step 6
   - Yes → Continue
9. [Process] Create user account
10. [End] Redirect to homepage
""",
    "decisions": """
- Phone number format judgment: Correct continue, error return
- Verification code validation: Correct create account, error re-enter (max 3 times)
""",
    "loops": """
- Phone number input loop: Loop when format error
- Verification code input loop: Loop when validation fails (max 3 times)
"""
}

flowchart_cfg = {
    "type": "Basic Flowchart",
    "direction": "Top to bottom",
    "color_scheme": "Professional blue (#1f2937, #3b82f6, #10b981)",
    "output_purpose": "Product documentation and technical specifications",
    "background": "White"
}

# Generate prompt
prompt = build_flowchart_prompt(process_desc, flowchart_cfg)
print("Generated Prompt:")
print(prompt)
2.2 Call API to Generate
def generate_flowchart(prompt, output_path):
    """Call API to generate flowchart"""

    try:
        # Call Nano Banana Pro
        response = model.generate_images(
            prompt=prompt,
            resolution="1920x1080",  # 16:9 suitable for presentations
            quality="high"
        )

        if response.images:
            # Save flowchart
            response.images[0].save(output_path)
            print(f"✅ Flowchart generated: {output_path}")
            return True
        else:
            print("❌ Generation failed: No image returned")
            return False

    except Exception as e:
        print(f"❌ Generation exception: {str(e)}")
        return False

# Generate flowchart
output_file = "./user_registration_flowchart.png"
success = generate_flowchart(prompt, output_file)
2.3 Batch Generate Multiple Flowcharts
def batch_generate_flowcharts(flowchart_configs, output_dir):
    """Batch generate multiple flowcharts"""

    from pathlib import Path
    import time

    output_dir = Path(output_dir)
    output_dir.mkdir(parents=True, exist_ok=True)

    results = []

    for idx, config in enumerate(flowchart_configs, 1):
        print(f"\n📊 Generating flowchart {idx}/{len(flowchart_configs)}...")
        print(f"   Name: {config['name']}")

        # Build prompt
        prompt = build_flowchart_prompt(
            config['process_description'],
            config['flowchart_config']
        )

        # Generate filename
        filename = f"{config['name'].replace(' ', '_')}.png"
        output_path = output_dir / filename

        # Generate flowchart
        success = generate_flowchart(prompt, output_path)

        results.append({
            "name": config['name'],
            "output_path": output_path,
            "success": success
        })

        # API rate limiting
        if idx < len(flowchart_configs):
            time.sleep(1)

    # Statistics
    success_count = sum(1 for r in results if r['success'])
    print(f"\n✅ Batch generation complete: {success_count}/{len(flowchart_configs)} successful")

    return results

# Batch generation example
flowchart_batch = [
    {
        "name": "User Registration Process",
        "process_description": { ... },
        "flowchart_config": { ... }
    },
    {
        "name": "Order Approval Process",
        "process_description": { ... },
        "flowchart_config": { ... }
    },
    # ... More flowchart configurations
]

results = batch_generate_flowcharts(flowchart_batch, "./flowcharts")
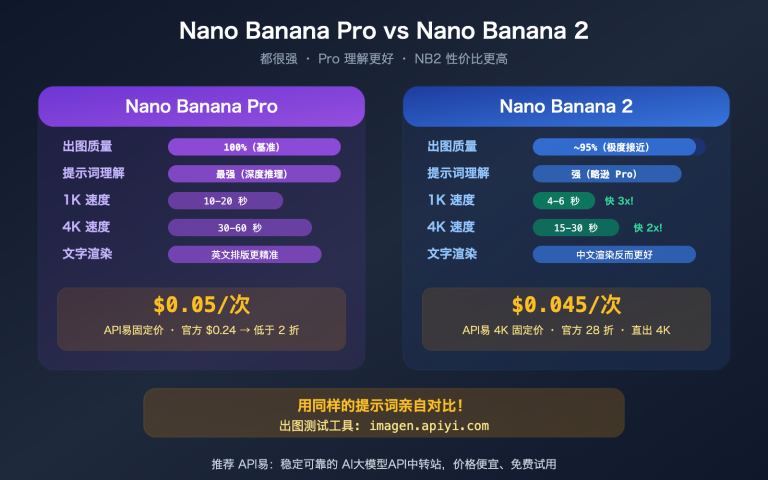
💰 Cost Optimization: For projects requiring large-scale flowchart generation, consider calling Nano Banana Pro API through the APIYI apiyi.com platform. This platform provides flexible billing methods and more favorable pricing. Batch flowchart generation costs approximately ¥2-5 per chart, reducing costs by 95% compared to traditional design outsourcing (¥50-200 per chart).
Step 3: Optimize and Export (1 minute)
Check and optimize the generated flowchart, export in the required format.
3.1 Flowchart Quality Check
def check_flowchart_quality(flowchart_path, process_config):
    """Flowchart quality checklist"""

    checklist = {
        "Structural Integrity": [
            "✓ Has clear start node",
            "✓ Has clear end node",
            "✓ All steps are connected",
            "✓ No isolated nodes"
        ],
        "Logical Accuracy": [
            "✓ Decision nodes have clear Yes/No branches",
            "✓ Loop logic clearly visible",
            "✓ Exception handling paths complete",
            "✓ Step order conforms to business logic"
        ],
        "Visual Clarity": [
            "✓ Nodes aligned neatly",
            "✓ Connections avoid crossings",
            "✓ Text clear and readable",
            "✓ Color scheme coordinated and professional"
        ],
        "Symbol Standardization": [
            "✓ Uses standard flowchart symbols",
            "✓ Symbols used correctly",
            "✓ Arrow directions clear",
            "✓ Condition labels clear"
        ]
    }

    print(f"\n📋 Flowchart Quality Check: {process_config['name']}")
    for category, items in checklist.items():
        print(f"\n{category}:")
        for item in items:
            print(f"  {item}")

    return checklist

# Execute check
check_flowchart_quality(
    "./user_registration_flowchart.png",
    {"name": "User Registration Process"}
)
3.2 Format Conversion and Export
from PIL import Image
import io

def export_multiple_formats(flowchart_path, output_dir):
    """Export multiple formats"""

    from pathlib import Path

    flowchart_path = Path(flowchart_path)
    output_dir = Path(output_dir)
    output_dir.mkdir(parents=True, exist_ok=True)

    base_name = flowchart_path.stem

    # Open original image
    img = Image.open(flowchart_path)

    # 1. High-resolution PNG (original)
    png_path = output_dir / f"{base_name}_hd.png"
    img.save(png_path, "PNG", optimize=True)
    print(f"✅ PNG: {png_path}")

    # 2. Compressed PNG (suitable for web)
    web_img = img.copy()
    web_img.thumbnail((1280, 720), Image.Resampling.LANCZOS)
    web_path = output_dir / f"{base_name}_web.png"
    web_img.save(web_path, "PNG", optimize=True, quality=85)
    print(f"✅ Web PNG: {web_path}")

    # 3. JPG (suitable for email attachments)
    jpg_img = img.convert('RGB')
    jpg_path = output_dir / f"{base_name}.jpg"
    jpg_img.save(jpg_path, "JPEG", quality=90, optimize=True)
    print(f"✅ JPG: {jpg_path}")

    # 4. PDF (suitable for printing)
    pdf_path = output_dir / f"{base_name}.pdf"
    img.save(pdf_path, "PDF", resolution=300.0)
    print(f"✅ PDF: {pdf_path}")

    print(f"\n📦 Export complete, 4 formats total")

# Batch export
export_multiple_formats(
    "./user_registration_flowchart.png",
    "./exports"
)
3.3 Add Watermark and Annotations
from PIL import Image, ImageDraw, ImageFont

def add_watermark(image_path, watermark_text, output_path):
    """Add watermark"""

    img = Image.open(image_path)
    draw = ImageDraw.Draw(img)

    # Set font
    try:
        font = ImageFont.truetype("Arial.ttf", 24)
    except:
        font = ImageFont.load_default()

    # Calculate watermark position (bottom right)
    text_bbox = draw.textbbox((0, 0), watermark_text, font=font)
    text_width = text_bbox[2] - text_bbox[0]
    text_height = text_bbox[3] - text_bbox[1]

    x = img.width - text_width - 20
    y = img.height - text_height - 20

    # Draw watermark (semi-transparent)
    draw.text((x, y), watermark_text, fill=(128, 128, 128, 128), font=font)

    # Save
    img.save(output_path)
    print(f"✅ Watermark added: {output_path}")

# Add watermark
add_watermark(
    "./user_registration_flowchart.png",
    "Created with Nano Banana Pro | apiyi.com",
    "./user_registration_flowchart_watermarked.png"
)
🎯 Technical Recommendation: In actual projects, we recommend batch generation and management of flowcharts through the APIYI apiyi.com platform. This platform provides comprehensive file management and version control features, supports online preview, sharing, and collaborative editing of flowcharts, improving team collaboration efficiency.
Advanced Applications: Complex Business Process Visualization
1. Multi-System Integration Process
integration_flowchart = """
Create an e-commerce order multi-system integration flowchart:

Involved Systems:
1. E-commerce Frontend
2. Order Center
3. Inventory System
4. Payment System
5. Logistics System
6. CRM System

Process Description:

[E-commerce Frontend]
- User places order

[Order Center]
- Receive order
- Create order record
- Call inventory system

[Inventory System]
- Check inventory
- Decision: Is inventory sufficient?
  - Insufficient → Notify order center, order failed
  - Sufficient → Lock inventory, notify order center to continue

[Order Center]
- Call payment system

[Payment System]
- Initiate payment
- Wait for payment result
- Decision: Is payment successful?
  - Failed → Notify order center, release inventory
  - Successful → Notify order center, payment complete

[Order Center]
- Confirm order
- Call logistics system

[Logistics System]
- Create shipping order
- Arrange delivery
- Update logistics status
- Notify CRM system

[CRM System]
- Send order confirmation email/SMS
- Update customer order history
- Calculate user points

[E-commerce Frontend]
- Display order status
- User views logistics

Design Requirements:
- Use cross-system flowchart (swimlane diagram)
- 6 swimlanes, arranged top to bottom
- Inter-system calls use dashed arrows
- Asynchronous notifications use wavy lines
- Key decision points highlighted with diamonds
- Color scheme: Each system uses different colored swimlane
- Label data flow and message types
"""
2. Exception Handling Process
exception_handling_flowchart = """
Create a payment exception handling flowchart:

Normal Process:
1. User initiates payment
2. Call payment gateway
3. Payment successful
4. Update order status
5. Complete

Exception Scenarios:

Scenario 1: Payment Timeout
- Trigger: 30 seconds no response
- Handling:
  1. Query payment status
  2. Decision: Is payment completed?
     - Completed → Update order, normal completion
     - Not completed → Close payment, prompt retry

Scenario 2: Payment Failure
- Trigger: Payment gateway returns failure
- Handling:
  1. Record failure reason
  2. Decision: Can retry?
     - Can retry → Prompt user to change payment method or retry
     - Cannot retry → Cancel order, return inventory

Scenario 3: Duplicate Payment
- Trigger: Same order multiple payment requests
- Handling:
  1. Query order payment status
  2. Decision: Already paid?
     - Already paid → Directly return success, prevent duplicate deduction
     - Not paid → Continue normal payment process

Scenario 4: Network Exception
- Trigger: Network connection failure
- Handling:
  1. Retry 3 times
  2. Decision: Retry successful?
     - Successful → Continue process
     - Failed → Transfer to manual processing, record exception

Design Requirements:
- Main process: Blue
- Exception paths: Red
- Retry loops: Dashed lines
- Exception capture points: Warning icons
- Recovery paths: Green
- Label each exception's trigger conditions and handling strategies
"""
3. Automation Workflow
automation_workflow = """
Create a CI/CD automated deployment flowchart:

Trigger Condition:
- Developer commits code to Git repository

Automation Process:

1. Git Webhook triggered
2. CI server receives notification
3. Pull latest code
4. Parallel execution:
   a. Code quality check
      - Run ESLint
      - Run Prettier
      - Decision: Passed?
        - Failed → Send notification, process ends
        - Passed → Continue
   b. Unit tests
      - Run Jest tests
      - Decision: Tests passed?
        - Failed → Send notification, process ends
        - Passed → Continue
5. Build application
   - Run npm run build
   - Decision: Build successful?
     - Failed → Send notification, process ends
     - Successful → Continue
6. Build Docker image
7. Push to image repository
8. Decision: Branch type?
   - develop branch → Deploy to test environment
   - master branch → Deploy to production environment
9. Health check
10. Decision: Service normal?
    - Abnormal → Auto rollback, send alert
    - Normal → Deployment successful, send notification

Notification Channels:
- DingTalk group message
- Email notification
- Slack message

Design Requirements:
- Parallel steps represented horizontally
- Automation steps use robot icons
- Manual intervention points use hand icons
- Success paths: Green
- Failure paths: Red
- Label estimated time for each step
"""
Frequently Asked Questions
Q1: What if the generated flowchart doesn't meet expectations?
A: Tips for optimizing prompts:
-
More detailed step descriptions: Don't just say "process data", specify "call data cleaning API, remove null values and duplicates"
-
Clear visual requirements: Add to prompt:
- Layout: Strictly top to bottom, no left-right branches - Node size: Uniform width 200px, height 60px - Connections: Right-angle connections, no curves -
Provide reference examples: Describe a similar flowchart as reference
-
Step-by-step generation: Complex processes can first generate main process, then exception process, finally merge
Q2: How to keep multiple flowcharts consistent in style?
A: Create unified style configuration:
# Enterprise flowchart standard style
company_flowchart_style = {
    "colors": {
        "primary": "#1f2937",    # Dark gray
        "accent": "#3b82f6",     # Blue
        "success": "#10b981",    # Green
        "error": "#ef4444",      # Red
        "warning": "#f59e0b"     # Orange
    },
    "fonts": {
        "title": "Arial Bold 16pt",
        "body": "Arial 12pt",
        "note": "Arial Italic 10pt"
    },
    "shapes": {
        "start_end": "Rounded rectangle, corner radius 8px",
        "process": "Rectangle",
        "decision": "Diamond",
        "data": "Parallelogram"
    },
    "layout": {
        "direction": "top-to-bottom",
        "node_spacing": "40px",
        "branch_spacing": "60px"
    }
}

# Reference this style in each prompt
style_description = f"""
Color Scheme:
- Primary: {company_flowchart_style['colors']['primary']}
- Accent: {company_flowchart_style['colors']['accent']}
- Success: {company_flowchart_style['colors']['success']}
- Error: {company_flowchart_style['colors']['error']}

Font Specifications:
- Title: {company_flowchart_style['fonts']['title']}
- Body: {company_flowchart_style['fonts']['body']}

Layout Specifications:
- Direction: {company_flowchart_style['layout']['direction']}
- Node spacing: {company_flowchart_style['layout']['node_spacing']}
"""
Q3: Can editable flowchart files be generated (like Visio format)?
A: Nano Banana Pro mainly outputs image formats (PNG/JPG) and doesn't directly generate editable vector files. However, there are alternative solutions:
-
Use SVG output: Request SVG format, can be edited in Adobe Illustrator, Sketch, etc.
-
Combine with professional tools:
- Use Nano Banana Pro to quickly generate prototypes
- Import into Figma/Sketch as reference
- Use professional tools for fine-tuning
-
Third-party conversion tools: Use OCR and vectorization tools to convert PNG to editable formats
Q4: What is the cost of flowchart generation?
A: Cost estimation (based on APIYI apiyi.com platform):
| Complexity | Step Count | Generation Time | Unit Price | Use Case |
|---|---|---|---|---|
| Simple | 5-10 steps | 10-20 seconds | ¥2-3 | SOP, simple operational processes |
| Medium | 10-20 steps | 20-40 seconds | ¥4-6 | Business processes, approval processes |
| Complex | 20-50 steps | 40-80 seconds | ¥8-12 | System integration, technical architecture |
| Ultra-complex | 50+ steps | 80+ seconds | ¥15-25 | Large projects, cross-system processes |
Compared to traditional methods:
- Manual drawing: ¥50-200/chart (1-2 hours)
- Outsourced design: ¥100-500/chart
- AI generation: ¥2-25/chart (1-2 minutes)
Cost reduction: 90-98%
💰 Cost Optimization: For enterprises requiring frequent flowchart updates, we recommend using the APIYI apiyi.com platform's monthly plans, enjoying bulk discounts and priority technical support, further reducing long-term usage costs.
Q5: How to handle ultra-large flowcharts (100+ steps)?
A: Ultra-large flowchart processing strategies:
Strategy 1: Layered Design
Main Flowchart (10-15 high-level steps)
   ↓
Sub-flowchart 1 (Detailed expansion of steps 1-3)
Sub-flowchart 2 (Detailed expansion of steps 4-7)
Sub-flowchart 3 (Detailed expansion of steps 8-15)
Strategy 2: Modular Generation
# Generate each module separately
module1 = generate_flowchart("User Authentication Module Process")
module2 = generate_flowchart("Order Processing Module Process")
module3 = generate_flowchart("Payment Settlement Module Process")

# Generate overview diagram, reference modules as sub-processes
overview = generate_flowchart("""
1. User Authentication [See: User Authentication Module]
2. Order Processing [See: Order Processing Module]
3. Payment Settlement [See: Payment Settlement Module]
""")
Strategy 3: Use Swimlane Diagram Simplification
- Convert complex sequential processes to cross-functional swimlane diagrams
- Steps within each swimlane are more concise
- Overall structure is clearer
Q6: Can generated flowcharts be used for commercial purposes?
A: Copyright statement:
- Generated through APIYI apiyi.com platform: Commercial usage rights belong to the customer
- Allowed: Use for product documentation, technical specifications, training materials, business proposals, etc.
- Allowed: Modify, optimize, secondary editing
- Allowed: Share with customers, team members, partners
Recommendations:
- Optionally label generation tool and platform in flowcharts
- Pay attention to confidentiality for sensitive business processes
- Flowcharts involving third-party brands require appropriate authorization
Summary and Best Practices
Nano Banana Pro's flowchart auto-generation capability reduces complex business process visualization from 1-2 hours to 5 minutes, improving efficiency by 12-24x. Mastering the following best practices can make your flowcharts more professional and efficient:
✅ Core Points
- Structured Description: Use clear step lists and conditional branches to describe business processes
- Choose the Right Type: Select appropriate flowchart type based on business scenario (basic/swimlane/timeline/decision tree/loop)
- Unified Style: Establish enterprise flowchart standard styles, maintain consistency
- Layered Design: Divide complex processes into main and sub-processes for easier understanding and maintenance
- Continuous Optimization: Update flowcharts promptly when business changes, keeping documentation consistent with reality
🎯 Application Recommendations
- Product Teams: Use flowcharts to organize user journeys and product feature logic
- Technical Teams: Use flowcharts to design system architecture and technical solutions
- Operations Teams: Use flowcharts to optimize business processes and approval links
- Training Teams: Use flowcharts to create operation manuals and training materials
🚀 Advanced Learning
- Explore interactive flowcharts (clickable sub-process expansion)
- Combine with animations to show process execution
- Integrate flowcharts into documentation generation systems
- Auto-generate code frameworks based on flowcharts
Through the APIYI apiyi.com platform's Nano Banana Pro API, you can quickly implement these advanced features and build enterprise-level process visualization solutions. From product design to technical documentation, from business optimization to team training, professional flowcharts will become your powerful tool for communication and collaboration.
Related Reading:
- Nano Banana Pro Infographic Generation Complete Guide
- Nano Banana Pro Whiteboard Explanation Diagram Generation Complete Guide
- Nano Banana Pro Mirror Comparison Generation Complete Guide